We use cookies to enhance the usability of our website. If you continue, we'll assume that you are happy to receive all cookies. More information. Don't show this again.
On the top, protein expression in current human tissue, based on all annotated cell types, is reported with the units not detected (n), low (l), medium (m) and high (h). Underneath, protein expression in each annotated cell type are reported using the same units.
Protein expression data is based on knowledge-based annotation. For genes where more than one antibody has been used, a collective score is set.
If knowledge-based annotation could not be performed for a gene, no data is displayed here. View antibody staining data further down this page.
h
m
l
n
Glial cells:
Low
Neuronal cells:
Medium
RNA expressioni
A summary of mRNA expression data available for current tissue based on several datasets. The mRNA expression levels in human tissues are based on RNA-seq data generated by the Human Protein Atlas (HPA), Genotype-Tissue Expression (GTEx) portal and CAGE data generated by the FANTOM5 consortium. Consensus normalized expression levels for human tissues was created by combining the data from HPA and GTEx datasets.
The mRNA expression levels in pig are based on RNA-seq data generated by the Human Protein Atlas (HPA), and for mouse, HPA data and in situ hybridization generated by the Allen brain atlas are reported.
Scroll down to view mRNA expression data in more detail.
Consensus:
108.2
nTPM
HPA Brain:
69.6
nTPM
GTEx:
108.2
nTPM
FANTOM5:
183.8
Scaled Tags Per Million
Pig:
117.1
nTPM
Mouse:
143.3
nTPM
Allen mouse:
9.9
Expression energy
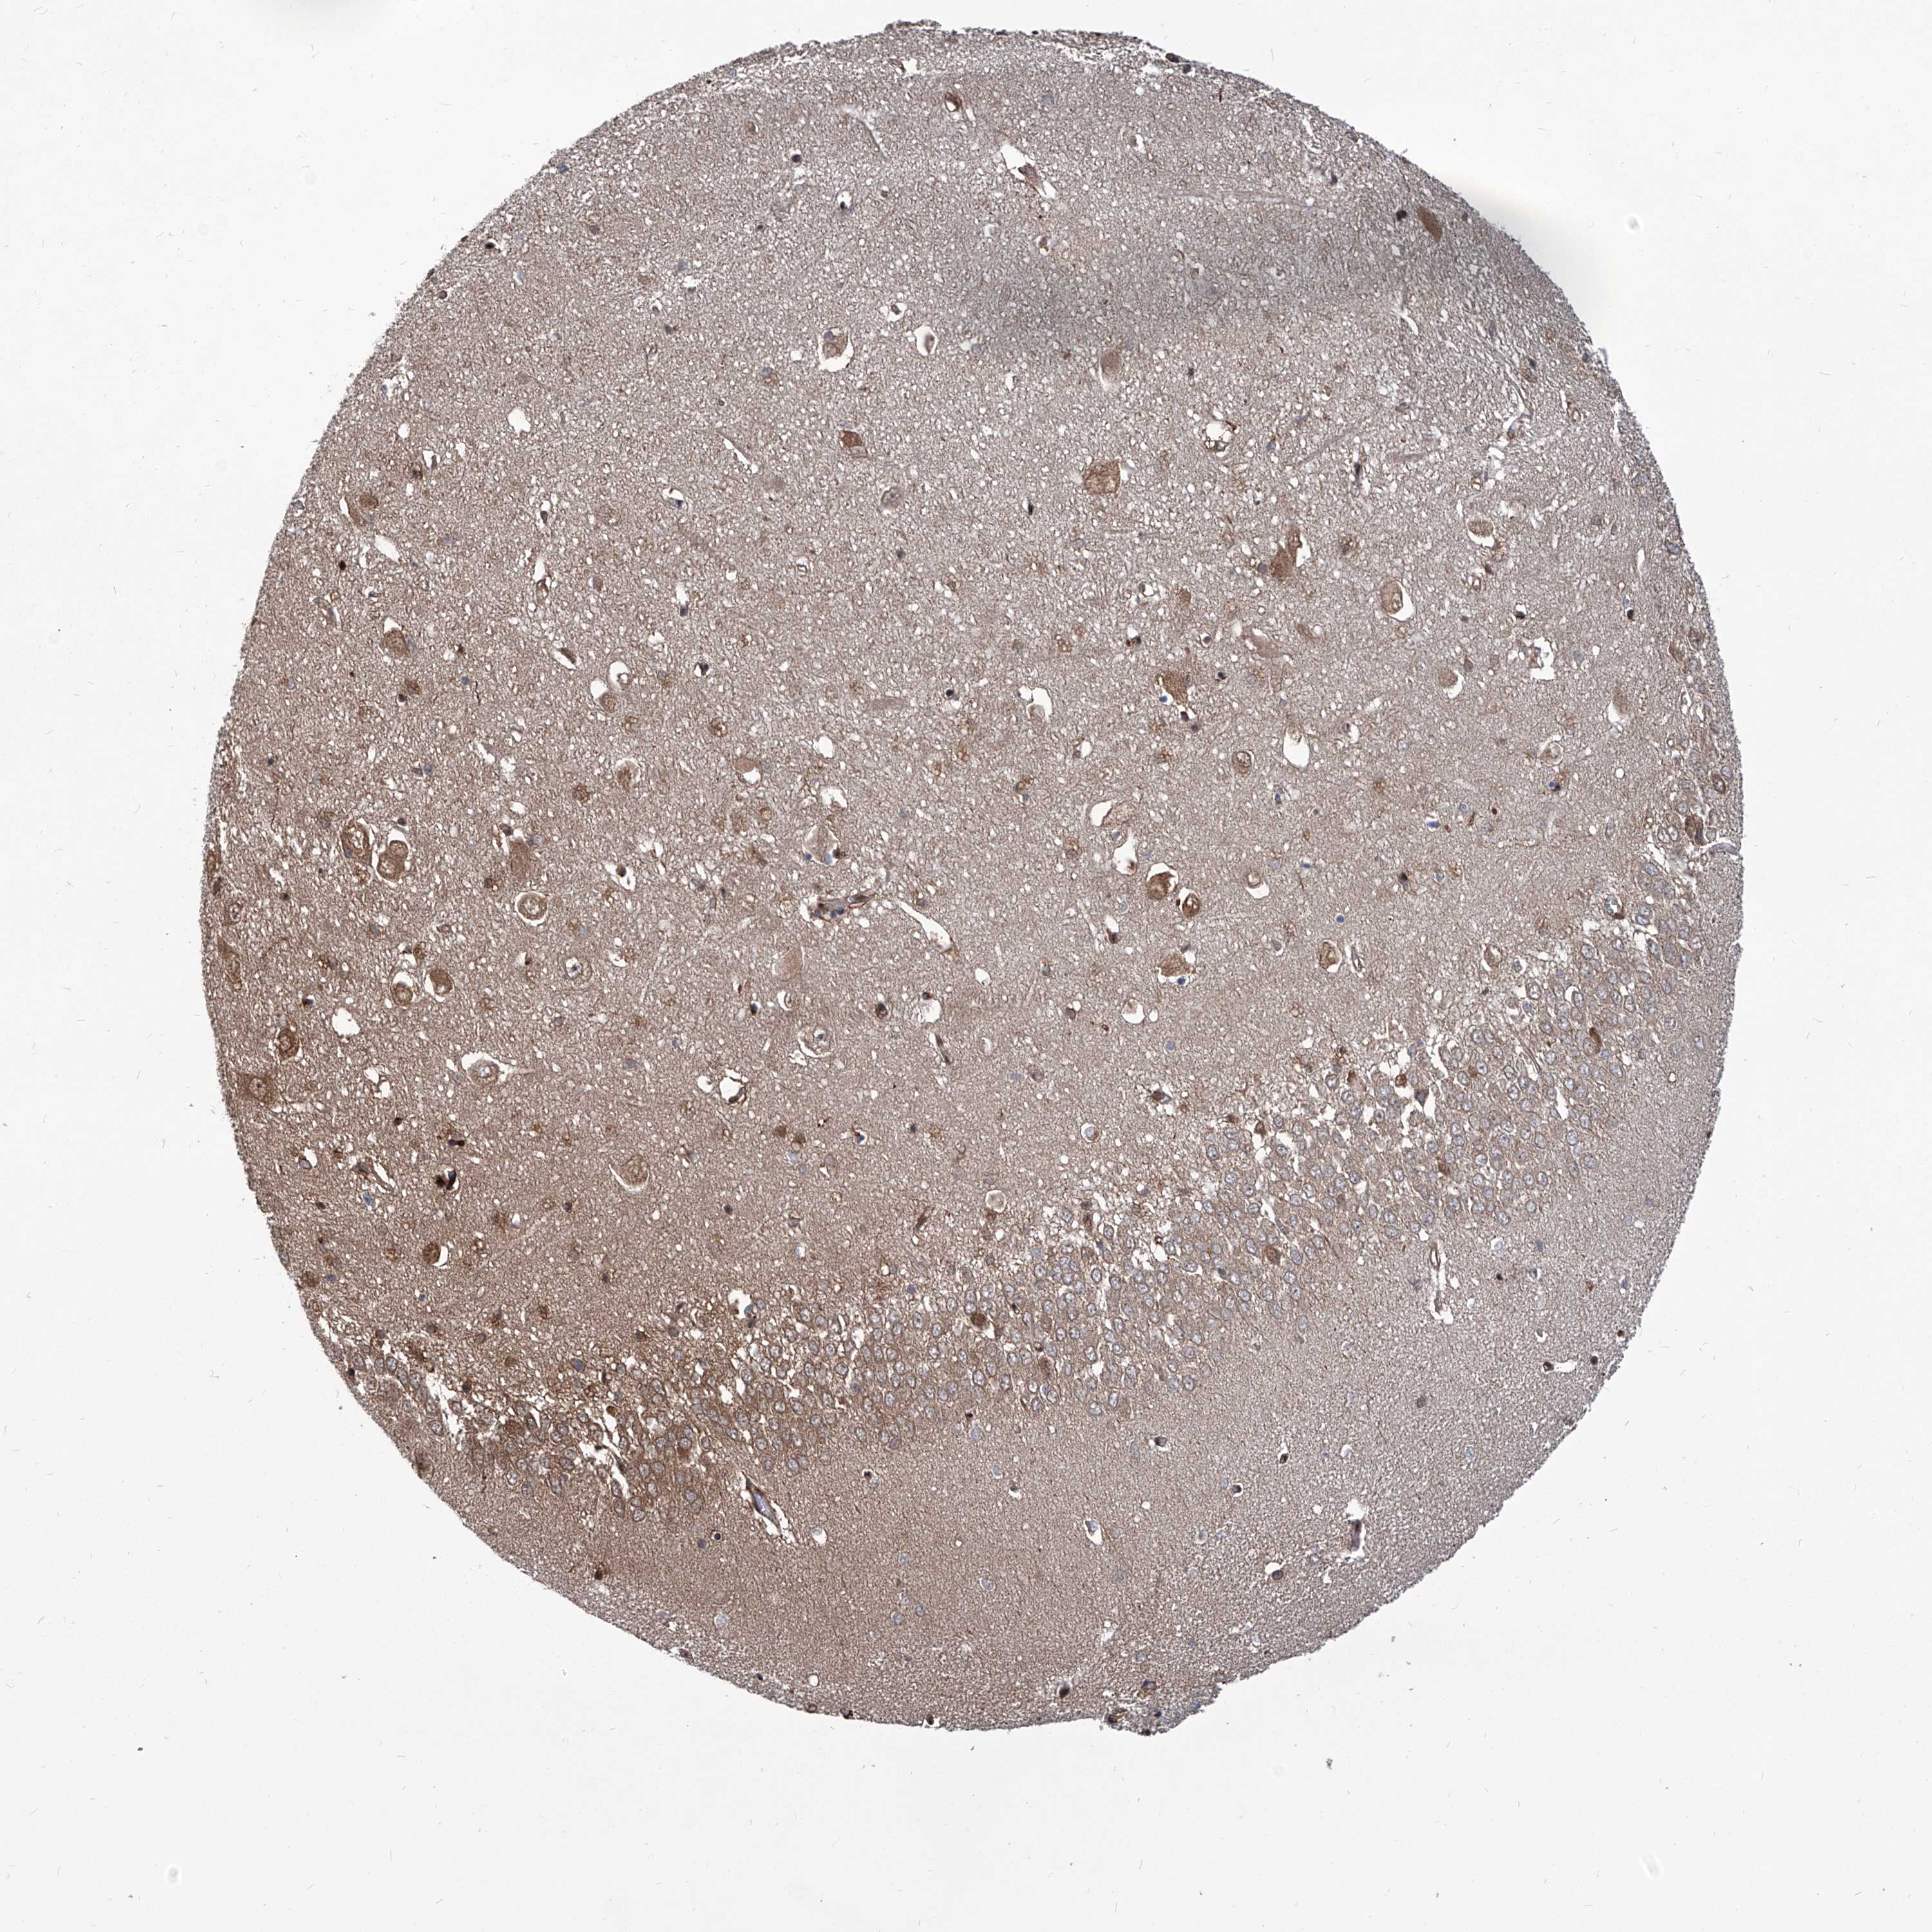
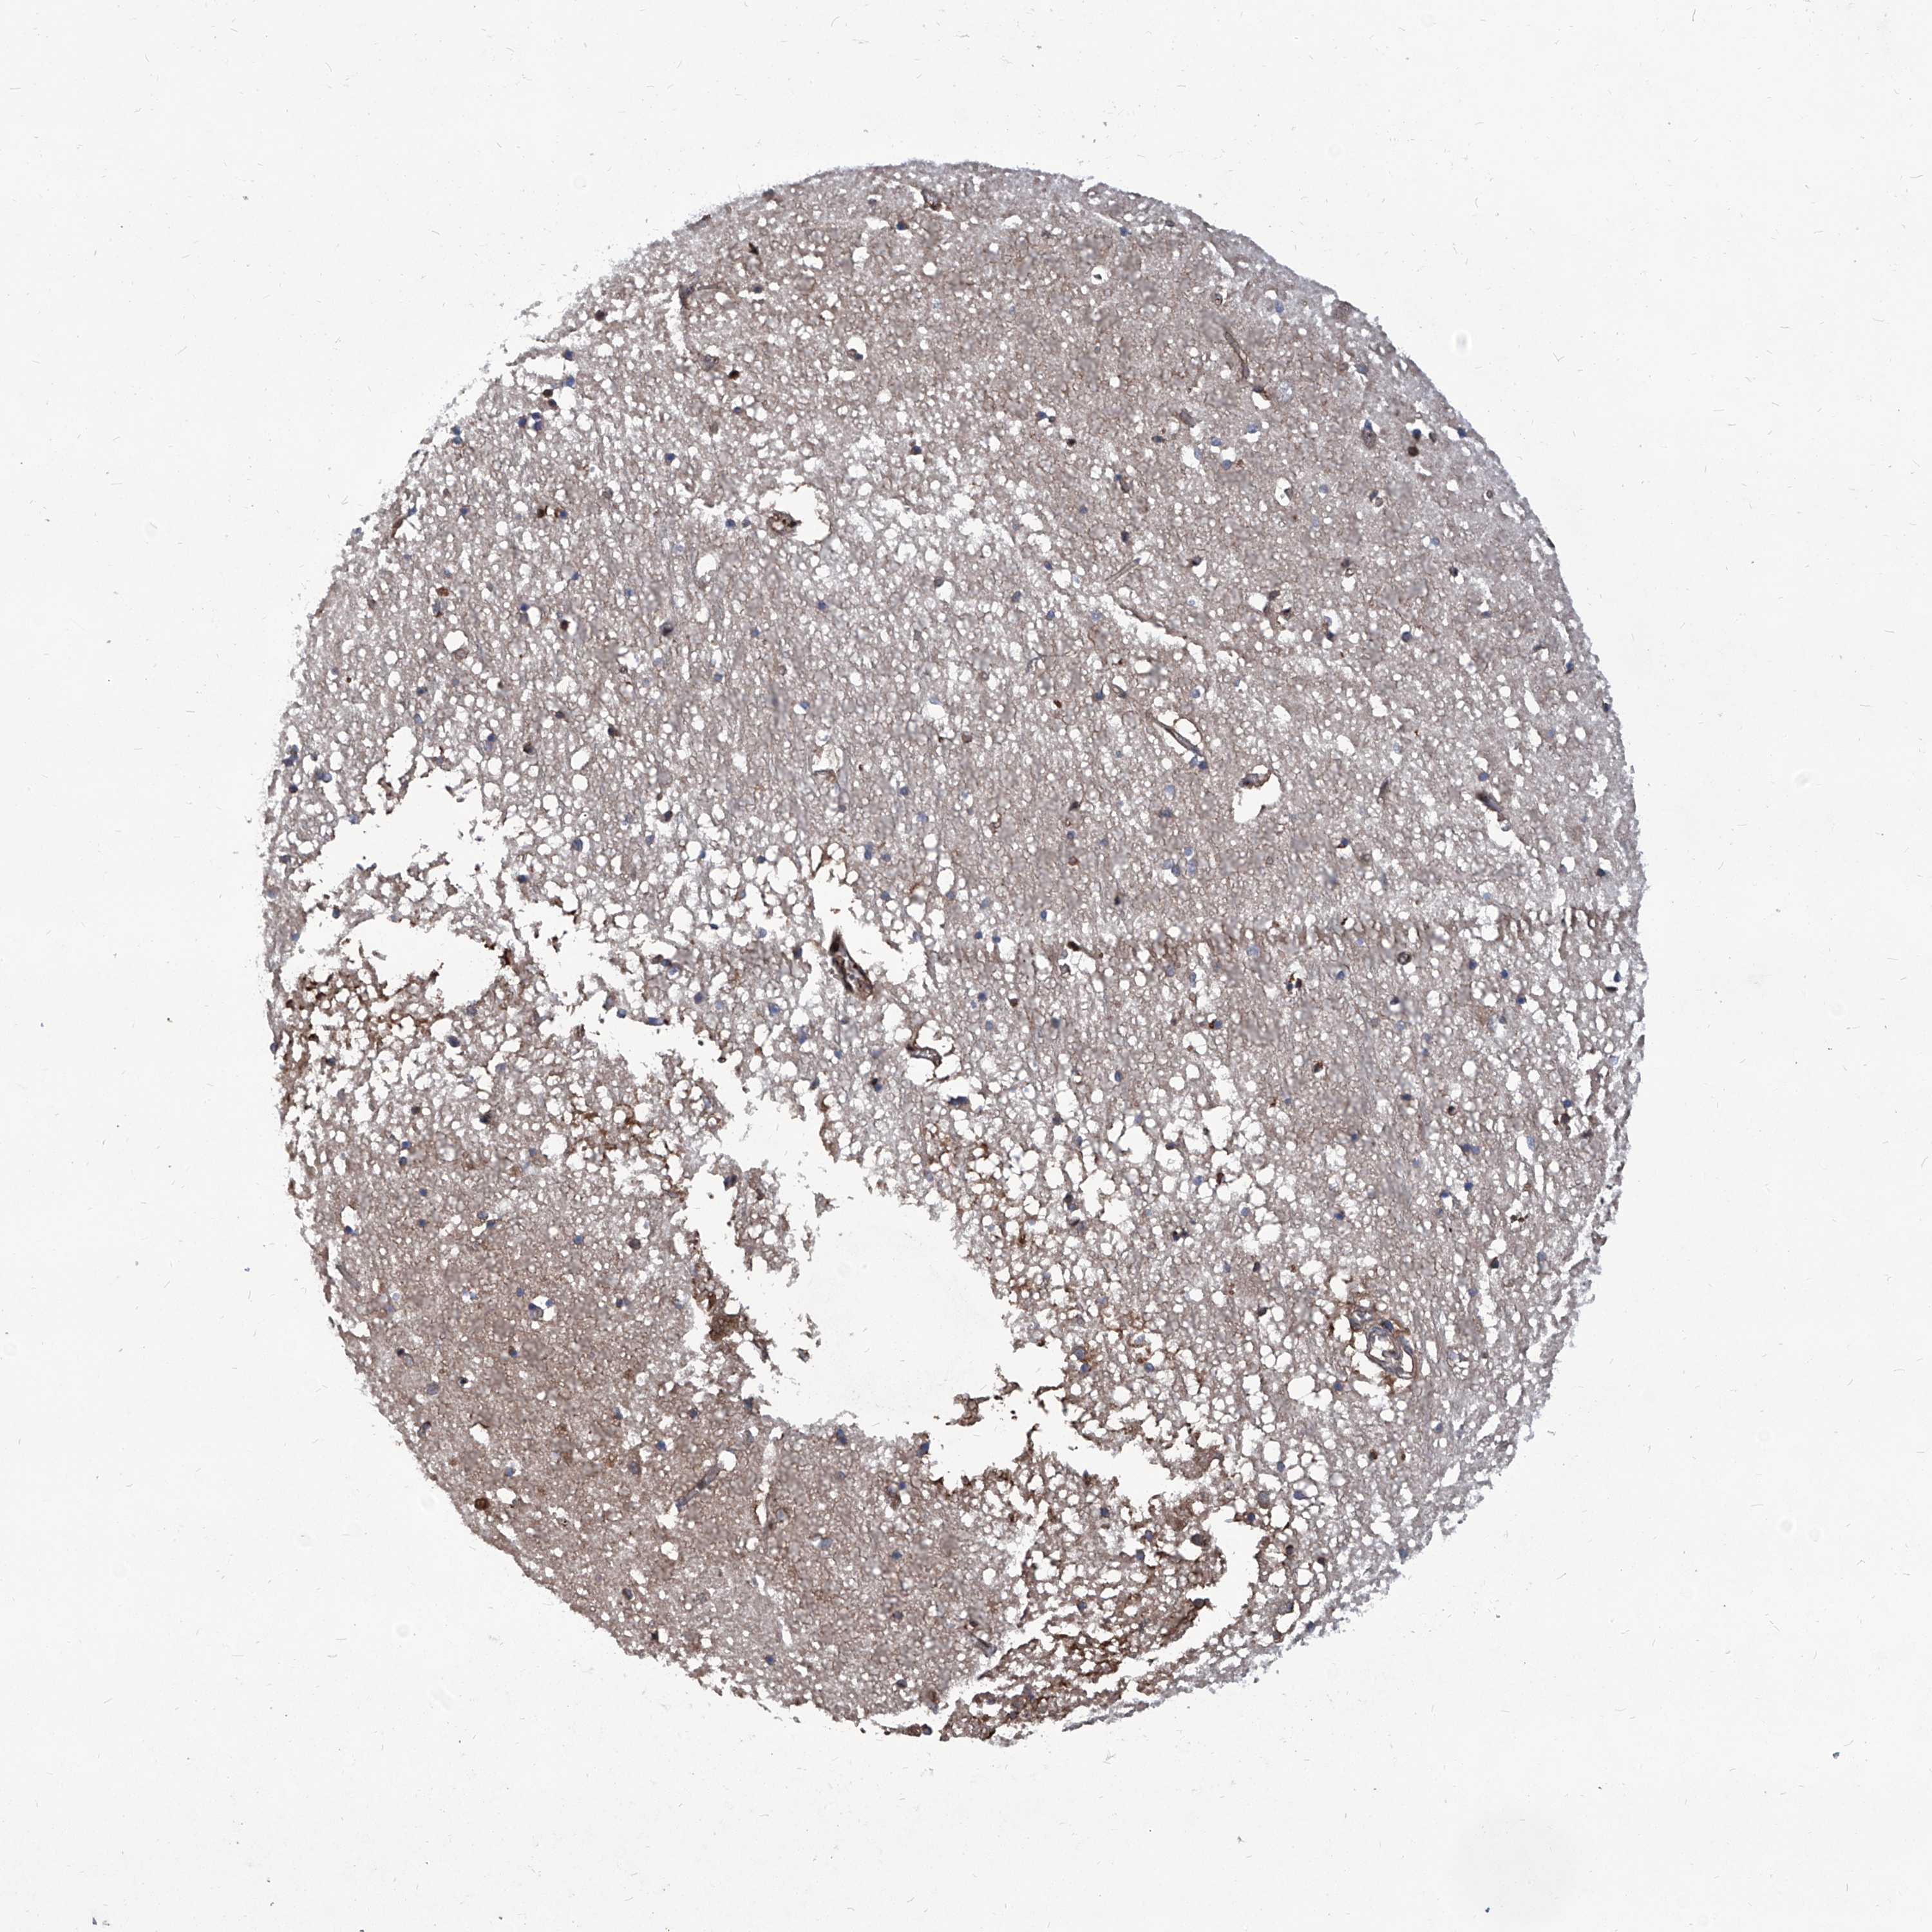
HIPPOCAMPUS - Antibody stainingi
Antibody staining in the annotated cell types in the current human tissue is reported as not detected, low, medium, or high, based on conventional immunohistochemistry profiling in selected tissues. This score is based on the combination of the staining intensity and fraction of stained cells.
Each image is clickable and will lead to virtual microscopy that enables deeper exploration of all samples and also displays staining intensity scores, fraction scores and subcellular localization as well as patient and tissue information for each sample.
Antibody HPA029635
Antibody HPA029637
Antibody CAB033911
Glial cells
Not detected
Low
Not detected
Neuronal cells
Medium
Medium
Medium
HIPPOCAMPAL FORMATION - HPA Brain RNA-seq
Max subtype nTPMi
Max subtype nTPM is the value for the subtype with the largest average nTPM across the subtype samples.
69.6
Sample id
Sample description
nTPM
Hippocampus nTPM: 62.7
1898
Male, age 80, left hemisphere
80.5
2529
Female, age 94, left hemisphere
70.0
2621
Female, age 67, right hemisphere
62.8
1911
Female, age 85, right hemisphere
57.1
2148
Female, age 91, left hemisphere
54.1
1855
Male, age 76, left hemisphere
51.9
Dentate gyrus nTPM: 61.1
1927
Female, age 91, both hemispheres
68.5
2010
Male, age 76, both hemispheres
66.7
2528
Male, age 74, both hemispheres
61.6
2246
Female, age 85, both hemispheres
58.9
2530
Female, age 94, left hemisphere
55.6
2531
Female, age 67, both hemispheres
55.1
Entorhinal gyrus nTPM: 61.9
2764
Male, age 80, right hemisphere
72.5
2117
Female, age 91, right hemisphere
68.2
1938
Female, age 85, left hemisphere
67.3
1787
Male, age 76, left hemisphere
59.5
2686
Male, age 75, right hemisphere
52.8
2613
Female, age 94, left hemisphere
51.2
Hippocampus, CA1 nTPM: 65.1
2749
Male, age 80, left hemisphere
80.1
1873
Female, age 85, both hemispheres
62.9
2045
Male, age 76, both hemispheres
62.3
2082
Female, age 91, right hemisphere
60.5
2527
Male, age 74, both hemispheres
59.7
Hippocampus, CA2 nTPM: 65.2
1963
Male, age 80, left hemisphere
74.7
2249
Male, age 74, both hemispheres
70.8
1892
Male, age 76, both hemispheres
66.0
2437
Female, age 94, left hemisphere
64.6
1940
Female, age 85, left hemisphere
58.7
2113
Female, age 91, right hemisphere
56.2
Hippocampus, CA3 nTPM: 62.4
2436
Male, age 74, both hemispheres
69.1
1891
Female, age 85, both hemispheres
68.7
2137
Male, age 80, left hemisphere
67.1
1867
Male, age 76, both hemispheres
64.6
2620
Female, age 94, left hemisphere
54.3
2861
Female, age 67, both hemispheres
50.7
Parahippocampal cortex nTPM: 58.9
1850
Male, age 80, both hemispheres
74.1
1990
Female, age 91, right hemisphere
68.4
2250
Female, age 67, right hemisphere
66.2
1933
Female, age 85, both hemispheres
63.5
2018
Male, age 76, both hemispheres
61.2
2532
Female, age 72, left hemisphere
58.1
2245
Female, age 91, both hemispheres
54.1
2693
Female, age 94, both hemispheres
53.5
2622
Female, age 67, right hemisphere
45.2
2692
Male, age 74, both hemispheres
44.8
Perirhinal gyrus nTPM: 69.6
1841
Female, age 85, right hemisphere
78.3
1847
Female, age 91, left hemisphere
77.9
1794
Male, age 80, right hemisphere
77.0
2848
Male, age 76, right hemisphere
58.2
2521
Female, age 94, right hemisphere
56.8
Subiculum nTPM: 61.6
1977
Female, age 85, both hemispheres
70.7
1901
Male, age 80, both hemispheres
64.0
2438
Female, age 94, left hemisphere
61.8
2042
Male, age 76, both hemispheres
59.5
2619
Male, age 74, both hemispheres
57.4
2729
Female, age 91, right hemisphere
56.0
HIPPOCAMPAL FORMATION - GTEx RNA-seqi
RNA-Seq data generated by the Genotype-Tissue Expression (GTEx) project from human tissues is reported as mean nTPM. More information can be found on the GTEx portal.
Distribution across the dataset is visualized with box plots, shown as median and 25th and 75th percentiles. Points are displayed as outliers if they are above or below 1.5 times the interquartile range. nTPM values of the individual samples are presented next to the box plot.
Max subtype nTPMi
Max subtype nTPM is the value for the subtype with the largest average nTPM across the subtype samples.
108.2
GTEx sample id
Sample description
nTPM
Brain - Hippocampus Average nTPM: 108.2
Samples: 197
Max nTPM: 218.8
Min nTPM: 68.6
Std nTPM: 20.1
Median nTPM: 105.0
GTEX-1CB4J-0011-R1a-SM-9WG64
60-69 years, male
218.8
GTEX-14LLW-0011-R1a-SM-5ZZVD
70-79 years, female
210.5
GTEX-11TUW-0011-R1a-SM-DO92S
60-69 years, male
176.3
GTEX-1B996-0011-R1b-SM-7P8PO
60-69 years, male
157.6
GTEX-1IOXB-0011-R1a-SM-D4P27
50-59 years, male
155.8
GTEX-1H1ZS-0011-R1b-SM-A9G1E
70-79 years, male
148.4
GTEX-144GL-0011-R1a-SM-5PNZ5
50-59 years, male
146.9
GTEX-13FXS-0011-R1a-SM-5K7U6
50-59 years, male
145.2
GTEX-145LU-0011-R1a-SM-5Q5CE
50-59 years, male
140.8
GTEX-1EX96-0011-R1a-SM-CE6R5
50-59 years, male
139.8
GTEX-1I1GS-0011-R1a-SM-CJI43
60-69 years, male
139.8
GTEX-18A6Q-0011-R1b-SM-731DI
60-69 years, male
138.8
GTEX-1GN73-0011-R1a-SM-CKZNT
60-69 years, male
138.5
GTEX-1HSKV-0011-R1b-SM-CMKH7
60-69 years, male
136.6
GTEX-15ER7-0011-R1b-SM-7KUE1
20-29 years, female
136.3
GTEX-OHPN-0011-R1A-SM-2I5GB
60-69 years, female
135.1
GTEX-1H3O1-0011-R1b-SM-CL554
60-69 years, male
135.0
GTEX-1J1OQ-0011-R1a-SM-A9G1Z
40-49 years, female
134.9
GTEX-13NYS-0011-R1b-SM-5MR55
60-69 years, male
134.8
GTEX-1H23P-0011-R1a-SM-ACKVC
60-69 years, male
132.3
GTEX-1399T-0011-R1b-SM-5DUWN
60-69 years, male
131.7
GTEX-1AX9I-0011-R1b-SM-7RHG2
60-69 years, male
131.3
GTEX-13N1W-0011-R1b-SM-5MR4T
70-79 years, male
130.1
GTEX-17MF6-0011-R1a-SM-72D6O
40-49 years, male
129.9
GTEX-1H4P4-0011-R1b-SM-CL54V
50-59 years, male
128.1
GTEX-1ICLZ-0011-R1b-SM-A9SM3
60-69 years, male
127.1
GTEX-1CAV2-0011-R1a-SM-ARZML
40-49 years, female
126.7
GTEX-1C6VQ-0011-R1a-SM-7P8Q2
50-59 years, male
126.2
GTEX-17HHY-0011-R1a-SM-7189V
50-59 years, male
125.5
GTEX-14PJM-0011-R1a-SM-CNPO3
50-59 years, female
123.0
GTEX-1J8Q2-0011-R1a-SM-D4P2D
60-69 years, male
122.0
GTEX-13O3O-0011-R1b-SM-5KM2K
60-69 years, female
121.9
GTEX-16NPV-0011-R1b-SM-7MGVZ
50-59 years, female
121.6
GTEX-1LB8K-0011-R1b-SM-EZ6MV
50-59 years, male
121.4
GTEX-13OW5-0011-R1b-SM-5L3GE
60-69 years, male
120.9
GTEX-17EVP-0011-R1a-SM-7DHLA
40-49 years, male
120.7
GTEX-1A32A-0011-R1a-SM-7P8SQ
50-59 years, female
120.1
GTEX-17HG3-0011-R1a-SM-7LG6H
30-39 years, female
119.5
GTEX-1F75A-0011-R1b-SM-CE6RA
50-59 years, male
119.2
GTEX-15CHQ-0011-R1a-SM-COH27
60-69 years, male
119.1
GTEX-N7MT-0011-R1a-SM-CNPO1
60-69 years, female
118.8
GTEX-13OVJ-0011-R1b-SM-5L3I6
50-59 years, female
118.7
GTEX-12WSH-0011-R1a-SM-5GU5V
50-59 years, male
118.4
GTEX-N7MS-0011-R1a-SM-2HMJG
60-69 years, male
117.9
GTEX-12ZZX-0011-R1a-SM-5EQ6B
40-49 years, female
117.5
GTEX-ZAB4-0011-R1a-SM-4RGNO
40-49 years, male
117.1
GTEX-17EVQ-0011-R1a-SM-7189S
70-79 years, male
117.0
GTEX-11GS4-0011-R1a-SM-DO129
60-69 years, male
116.8
GTEX-1GN1U-0011-R1a-SM-CJI25
50-59 years, female
116.8
GTEX-P44H-0011-R1A-SM-3NM8J
40-49 years, male
116.4
GTEX-1EKGG-0011-R1b-SM-9QEI1
60-69 years, male
116.4
GTEX-1HBPI-0011-R1b-SM-A9SKF
50-59 years, male
116.1
GTEX-TSE9-0011-R1A-SM-3DB7E
60-69 years, female
116.0
GTEX-1IY9M-0011-R1a-SM-EXURZ
60-69 years, male
116.0
GTEX-11DXW-0011-R1a-SM-DNZZD
40-49 years, male
115.8
GTEX-1F48J-0011-R1a-SM-9QEIC
50-59 years, female
115.5
GTEX-1A3MX-0011-R1b-SM-7P8PH
60-69 years, male
115.3
GTEX-13NYB-0011-R1b-SM-5KM4F
40-49 years, male
115.2
GTEX-13OVL-0011-R1a-SM-5L3H5
50-59 years, male
115.2
GTEX-1BAJH-0011-R1a-SM-7P8SV
70-79 years, male
115.2
GTEX-14BIM-0011-R1a-SM-69LQI
60-69 years, female
114.8
GTEX-1EMGI-0011-R1b-SM-9OSWZ
60-69 years, male
114.5
GTEX-1H3VE-0011-R1a-SM-A9G1K
40-49 years, male
113.9
GTEX-1GTWX-0011-R1a-SM-CE6RL
60-69 years, male
113.7
GTEX-X4EP-0011-R1A-SM-3P624
60-69 years, female
113.4
GTEX-13JVG-0011-R1a-SM-5KM32
60-69 years, male
113.3
GTEX-14C5O-0011-R1b-SM-6AJBW
60-69 years, male
112.3
GTEX-1B933-0011-R1b-SM-9QEGW
50-59 years, female
111.8
GTEX-183WM-0011-R1a-SM-718A8
70-79 years, female
111.5
GTEX-1E2YA-0011-R1b-SM-CJI29
50-59 years, male
111.4
GTEX-13FHO-0011-R1b-SM-5KLZG
60-69 years, male
110.9
GTEX-1A8G6-0011-R1a-SM-7P8PC
60-69 years, male
110.8
GTEX-1H3NZ-0011-R1a-SM-CKZP5
60-69 years, male
110.8
GTEX-1CB4G-0011-R1b-SM-9QEHT
60-69 years, male
110.7
GTEX-1HT8W-0011-R1b-SM-CJI3V
30-39 years, male
110.7
GTEX-13112-0011-R1b-SM-5HL7K
50-59 years, male
110.3
GTEX-T6MN-0011-R1A-SM-32QOY
50-59 years, male
110.2
GTEX-1EWIQ-0011-R1a-SM-9OSX7
70-79 years, female
110.2
GTEX-Y8DK-0011-R1A-SM-4RGLO
60-69 years, male
109.6
GTEX-1GZ2Q-0011-R1a-SM-CJI2Y
40-49 years, male
109.2
GTEX-QMR6-0011-R1A-SM-32PKW
50-59 years, male
109.1
GTEX-1EH9U-0011-R1b-SM-CJI2B
60-69 years, male
109.1
GTEX-13QIC-0011-R1a-SM-5O9CJ
60-69 years, female
108.6
GTEX-1H1CY-0011-R1a-SM-CKZOZ
60-69 years, female
107.6
GTEX-1C64N-0011-R1b-SM-7P8Q7
50-59 years, male
107.4
GTEX-131YS-0011-R1a-SM-5DUXC
60-69 years, female
107.3
GTEX-139TT-0011-R1a-SM-5LZVD
60-69 years, male
106.9
GTEX-1GZHY-0011-R1a-SM-CE6RR
50-59 years, female
106.5
GTEX-1B8SF-0011-R1b-SM-7P8Q8
60-69 years, male
106.4
GTEX-1F75W-0011-R1a-SM-ARU81
60-69 years, male
106.4
GTEX-1IKK5-0011-R1b-SM-CE6SQ
60-69 years, male
106.4
GTEX-139T8-0011-R1a-SM-5HL75
60-69 years, male
106.1
GTEX-1E1VI-0011-R1a-SM-ARZMM
50-59 years, male
106.0
GTEX-144GO-0011-R1a-SM-5PNWO
60-69 years, male
105.6
GTEX-12WSF-0011-R1a-SM-5DUVI
70-79 years, male
105.5
GTEX-15DCD-0011-R1b-SM-6LPIJ
70-79 years, female
105.5
GTEX-ZDXO-0011-R1a-SM-4WKF4
60-69 years, male
105.1
GTEX-17HII-0011-R1b-SM-7MGVW
50-59 years, male
105.1
GTEX-13QJC-0011-R1b-SM-5S2UU
60-69 years, female
105.0
GTEX-11GSP-0011-R1a-SM-9QEJ3
60-69 years, female
105.0
GTEX-13RTJ-0011-R1a-SM-5O9D9
60-69 years, male
104.9
GTEX-131XH-0011-R1a-SM-5DUWA
50-59 years, male
104.8
GTEX-1GMR8-0011-R1b-SM-CJI2O
50-59 years, female
104.6
GTEX-1313W-0011-R1b-SM-5EQ4A
50-59 years, female
104.1
GTEX-1I1GV-0011-R1a-SM-CL559
60-69 years, male
103.6
GTEX-13G51-0011-R1a-SM-5LZYR
60-69 years, male
103.5
GTEX-14PJO-0011-R1b-SM-6AJAK
60-69 years, male
103.4
GTEX-1IDJH-0011-R1b-SM-ARU6U
70-79 years, male
103.4
GTEX-14PQA-0011-R1b-SM-6EU1G
50-59 years, female
103.3
GTEX-1F6I4-0011-R1a-SM-9OSWU
60-69 years, male
103.2
GTEX-11EI6-0011-R1a-SM-DO93L
60-69 years, male
103.1
GTEX-13O3Q-0011-R1b-SM-5KM3L
50-59 years, male
102.9
GTEX-1C6VR-0011-R1a-SM-7MXUE
60-69 years, male
102.6
GTEX-13JUV-0011-R1a-SM-5LZY4
40-49 years, female
102.1
GTEX-16XZZ-0011-R1a-SM-7LTAH
60-69 years, male
102.1
GTEX-1LG7Y-0011-R1a-SM-EYYWV
50-59 years, male
102.1
GTEX-NPJ7-0011-R1a-SM-3GACT
60-69 years, female
102.0
GTEX-1B8L1-0011-R1a-SM-7P8SS
60-69 years, male
101.8
GTEX-13RTL-0011-R1a-SM-5PNZ8
40-49 years, male
101.7
GTEX-15UF6-0011-R1a-SM-9QEGH
70-79 years, female
101.6
GTEX-ZVZQ-0011-R1a-SM-57WBU
60-69 years, female
101.3
GTEX-ZUA1-0011-R1a-SM-4YCE2
40-49 years, male
101.2
GTEX-S7SE-0011-R1A-SM-2XCDE
50-59 years, male
101.0
GTEX-11GSO-0011-R1b-SM-57WD3
60-69 years, male
100.7
GTEX-1H1DG-0011-R1b-SM-CKZP1
70-79 years, male
100.5
GTEX-14JIY-0011-R1a-SM-68713
60-69 years, male
100.3
GTEX-1GF9V-0011-R1a-SM-CKZNQ
60-69 years, male
100.0
GTEX-WHSE-0011-R1A-SM-3P5ZK
20-29 years, male
99.7
GTEX-1GF9W-0011-R1a-SM-9QEIQ
60-69 years, male
99.5
GTEX-UTHO-0011-R1A-SM-3GIJO
60-69 years, male
99.2
GTEX-14E7W-0011-R1b-SM-5YYAT
70-79 years, male
99.1
GTEX-1HR98-0011-R1a-SM-ARZLQ
60-69 years, male
99.1
GTEX-11ONC-0011-R1a-SM-57WD4
60-69 years, male
98.8
GTEX-1HGF4-0011-R1a-SM-CJI3S
60-69 years, male
98.8
GTEX-1I1GQ-0011-R1a-SM-CY8GG
50-59 years, male
98.8
GTEX-P44G-0011-R1A-SM-2I3FE
30-39 years, male
98.7
GTEX-X585-0011-R1B-SM-46MVE
50-59 years, male
98.6
GTEX-13OW8-0011-R1a-SM-5L3HI
60-69 years, male
98.5
GTEX-1GN2E-0011-R1b-SM-CE6RJ
60-69 years, male
98.3
GTEX-11ZVC-0011-R1b-SM-5BC6M
50-59 years, female
98.2
GTEX-132Q8-0011-R1a-SM-5EGLK
60-69 years, male
98.1
GTEX-11ZTS-0011-R1a-SM-5BC71
60-69 years, female
97.8
GTEX-13NZA-0011-R1b-SM-5LUAF
60-69 years, male
97.7
GTEX-12WSE-0011-R1b-SM-5GU4V
20-29 years, male
97.6
GTEX-14ABY-0011-R1a-SM-6EU2W
50-59 years, male
97.1
GTEX-RNOR-0011-R1A-SM-CNNP5
50-59 years, female
96.6
GTEX-YJ89-0011-R1a-SM-4RGLS
60-69 years, male
96.3
GTEX-YFC4-0011-R1a-SM-4V6EH
40-49 years, female
96.2
GTEX-NL3H-0011-R1a-SM-48TDJ
60-69 years, male
96.1
GTEX-13X6I-0011-R1b-SM-5PNZC
60-69 years, male
96.0
GTEX-1212Z-0011-R1b-SM-5BC72
60-69 years, male
95.5
GTEX-PWO3-0011-R1A-SM-2I5EW
60-69 years, female
95.5
GTEX-1F6IF-0011-R1b-SM-9WG78
60-69 years, male
95.1
GTEX-11UD1-0011-R1b-SM-5BC7D
40-49 years, female
95.0
GTEX-WWYW-0011-R1A-SM-3TW8G
50-59 years, female
94.3
GTEX-14E6D-0011-R1b-SM-5YYAW
50-59 years, male
94.2
GTEX-1I1HK-0011-R1b-SM-CM2T7
60-69 years, male
94.0
GTEX-13S7M-0011-R1b-SM-5PNZE
60-69 years, female
93.9
GTEX-1HSMO-0011-R1a-SM-CM2SV
60-69 years, male
93.8
GTEX-17JCI-0011-R1b-SM-718A3
60-69 years, female
93.7
GTEX-13CF2-0011-R1a-SM-5LZY1
60-69 years, male
93.1
GTEX-ZE7O-0011-R1a-SM-57WDM
50-59 years, female
92.8
GTEX-QVUS-0011-R1A-SM-3GAD2
60-69 years, female
92.1
GTEX-13N2G-0011-R1b-SM-5MR3G
60-69 years, male
91.4
GTEX-14PN4-0011-R1b-SM-69LP8
50-59 years, male
91.2
GTEX-WZTO-0011-R1B-SM-3NMAR
40-49 years, male
91.2
GTEX-16YQH-0011-R1a-SM-7LT8R
30-39 years, male
91.0
GTEX-12WSD-0011-R1b-SM-5LZVY
60-69 years, female
90.9
GTEX-T5JC-0011-R1A-SM-32PM6
20-29 years, male
90.8
GTEX-17F97-0011-R1b-SM-7IGM9
50-59 years, male
90.0
GTEX-WVLH-0011-R1A-SM-4MVOK
50-59 years, male
89.5
GTEX-Q2AG-0011-R1A-SM-2HMJI
40-49 years, female
89.4
GTEX-QDT8-0011-R1A-SM-32PKS
30-39 years, female
89.4
GTEX-145LS-0011-R1b-SM-5PNUP
60-69 years, female
89.0
GTEX-13OW6-0011-R1a-SM-5L3HQ
50-59 years, male
88.8
GTEX-ZF28-0011-R1a-SM-4WWD1
60-69 years, male
88.0
GTEX-13OW7-0011-R1b-SM-5L3HF
50-59 years, male
87.7
GTEX-WL46-0011-R1A-SM-3LK6M
50-59 years, male
87.7
GTEX-PVOW-0011-R1A-SM-32PL6
40-49 years, male
87.6
GTEX-XMD1-0011-R1A-SM-4AT4C
60-69 years, male
87.2
GTEX-12WSM-0011-R1a-SM-5LZW6
60-69 years, male
86.9
GTEX-QVJO-0011-R1A-SM-2S1QI
60-69 years, female
86.3
GTEX-13FHP-0011-R1b-SM-5K7XL
50-59 years, male
85.8
GTEX-13SLW-0011-R1a-SM-5S2W7
70-79 years, male
85.7
GTEX-X4XX-0011-R1B-SM-3P622
60-69 years, male
84.9
GTEX-13PDP-0011-R1a-SM-5PNX5
60-69 years, male
84.4
GTEX-13FLW-0011-R1b-SM-5LZX2
50-59 years, male
83.1
GTEX-11WQC-0011-R1b-SM-DO932
60-69 years, male
81.5
GTEX-13NZ8-0011-R1b-SM-5KM3V
60-69 years, female
78.8
GTEX-16Z82-0011-R1b-SM-7EPHZ
60-69 years, male
78.6
GTEX-145MH-0011-R1b-SM-5PNWY
50-59 years, male
77.9
GTEX-14ASI-0011-R1b-SM-5S2TY
60-69 years, male
77.5
GTEX-16GPK-0011-R1b-SM-7EWDH
60-69 years, male
77.2
GTEX-R55E-0011-R1A-SM-2TC6N
20-29 years, male
76.6
GTEX-13FTY-0011-R1a-SM-5LZXE
40-49 years, female
75.7
GTEX-NPJ8-0011-R1a-SM-33HCB
40-49 years, male
72.9
GTEX-14LZ3-0011-R1a-SM-69LP5
60-69 years, female
68.6
Show allShow less
HIPPOCAMPAL FORMATION - FANTOM5 CAGEi
RNA expression in human tissues obtained through Cap Analysis of Gene Expression (CAGE) generated by the FANTOM5 project are reported as Scaled Tags Per Million.
Max subtype Scaled Tags Per Millioni
Max subtype Scaled Tags Per Million is the value for the subtype with the largest average Scaled Tags Per Million across the subtype samples.
Normal distribution across the dataset is visualized with box plots, shown as median and 25th and 75th percentiles. Points are displayed as outliers if they are above or below 1.5 times the interquartile range. nTPM values of the individual samples are presented next to the box plot.
Max subtype nTPMi
Max subtype nTPM is the value for the subtype with the largest average nTPM across the subtype samples.
143.3
Mouse sample
Sample description
nTPM
Entorhinal cortex nTPM: 134.4
Samples: 4
Max nTPM: 141.0
Min nTPM: 127.3
Sample A
Male
127.3
Sample B
Male
138.8
Sample C
Female
141.0
Sample D
Female
130.5
Hippocampal formation nTPM: 143.3
Samples: 4
Max nTPM: 166.3
Min nTPM: 133.0
Sample A
Male
166.3
Sample B
Male
133.0
Sample C
Female
135.5
Sample D
Female
138.2
HIPPOCAMPAL FORMATION - Allen Mouse ISHi
In situ hybridization (ISH) data generated by the Allen brain atlas from mouse brain is reported as expression energy. For more details about a particular experiment, click on the corresponding Allen experiment ID.
Max subtype Expression energyi
Max subtype Expression energy is the value for the subtype with the largest average Expression energy across the subtype samples.
 The Human Protein Atlas project is funded