Search result
SUMMARY

TISSUE
BRAIN
SINGLE CELL

SUBCELL
CANCER
BLOOD
CELL LINE
STRUCT & INT
|
STRUCTURE & INTERACTION
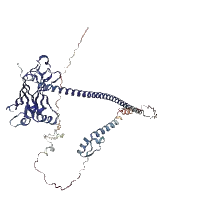
STRUCTURE
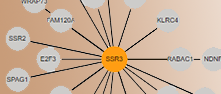
INTERACTION
Protein structures
Protein interactions
Human metabolism
 |
|
||||||||||||||||||||||||||||||||||||||||||||||||||||||||||||||||||||||||||||||||||||||||||||||||||||||||||||||||||||||
 The Human Protein Atlas project is funded