Search result
|
TISSUE
PRIMARY DATA
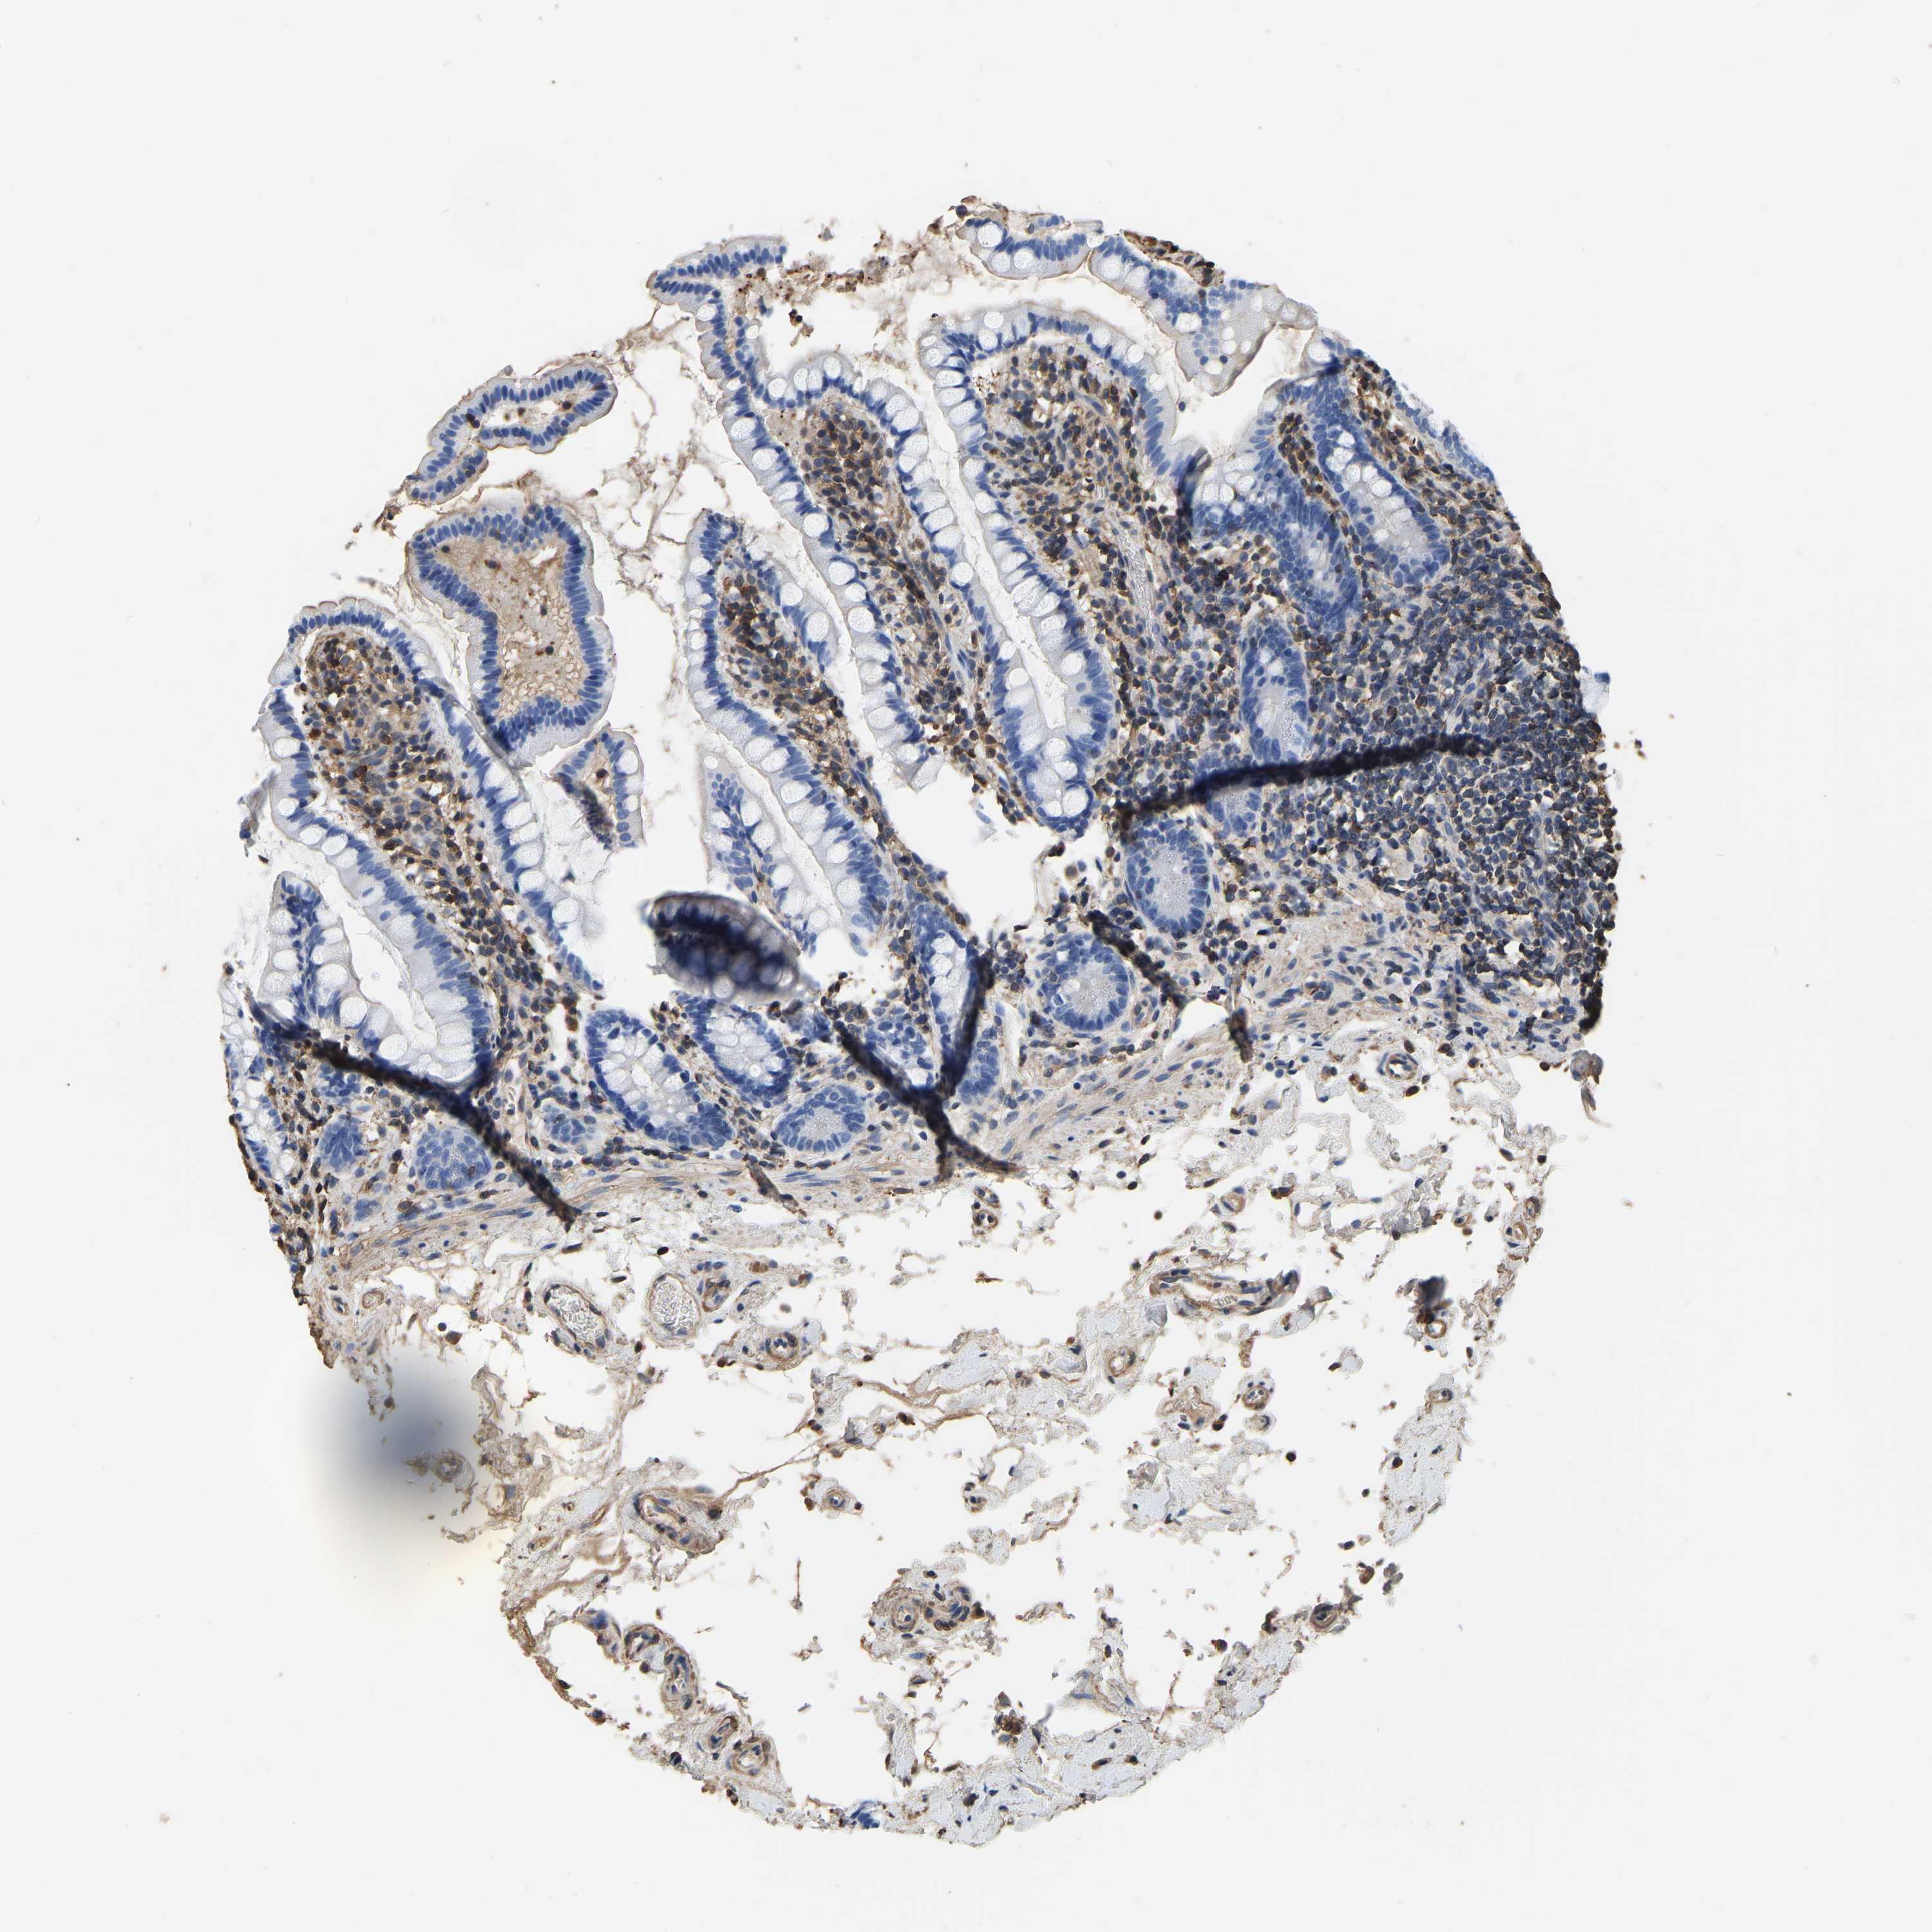
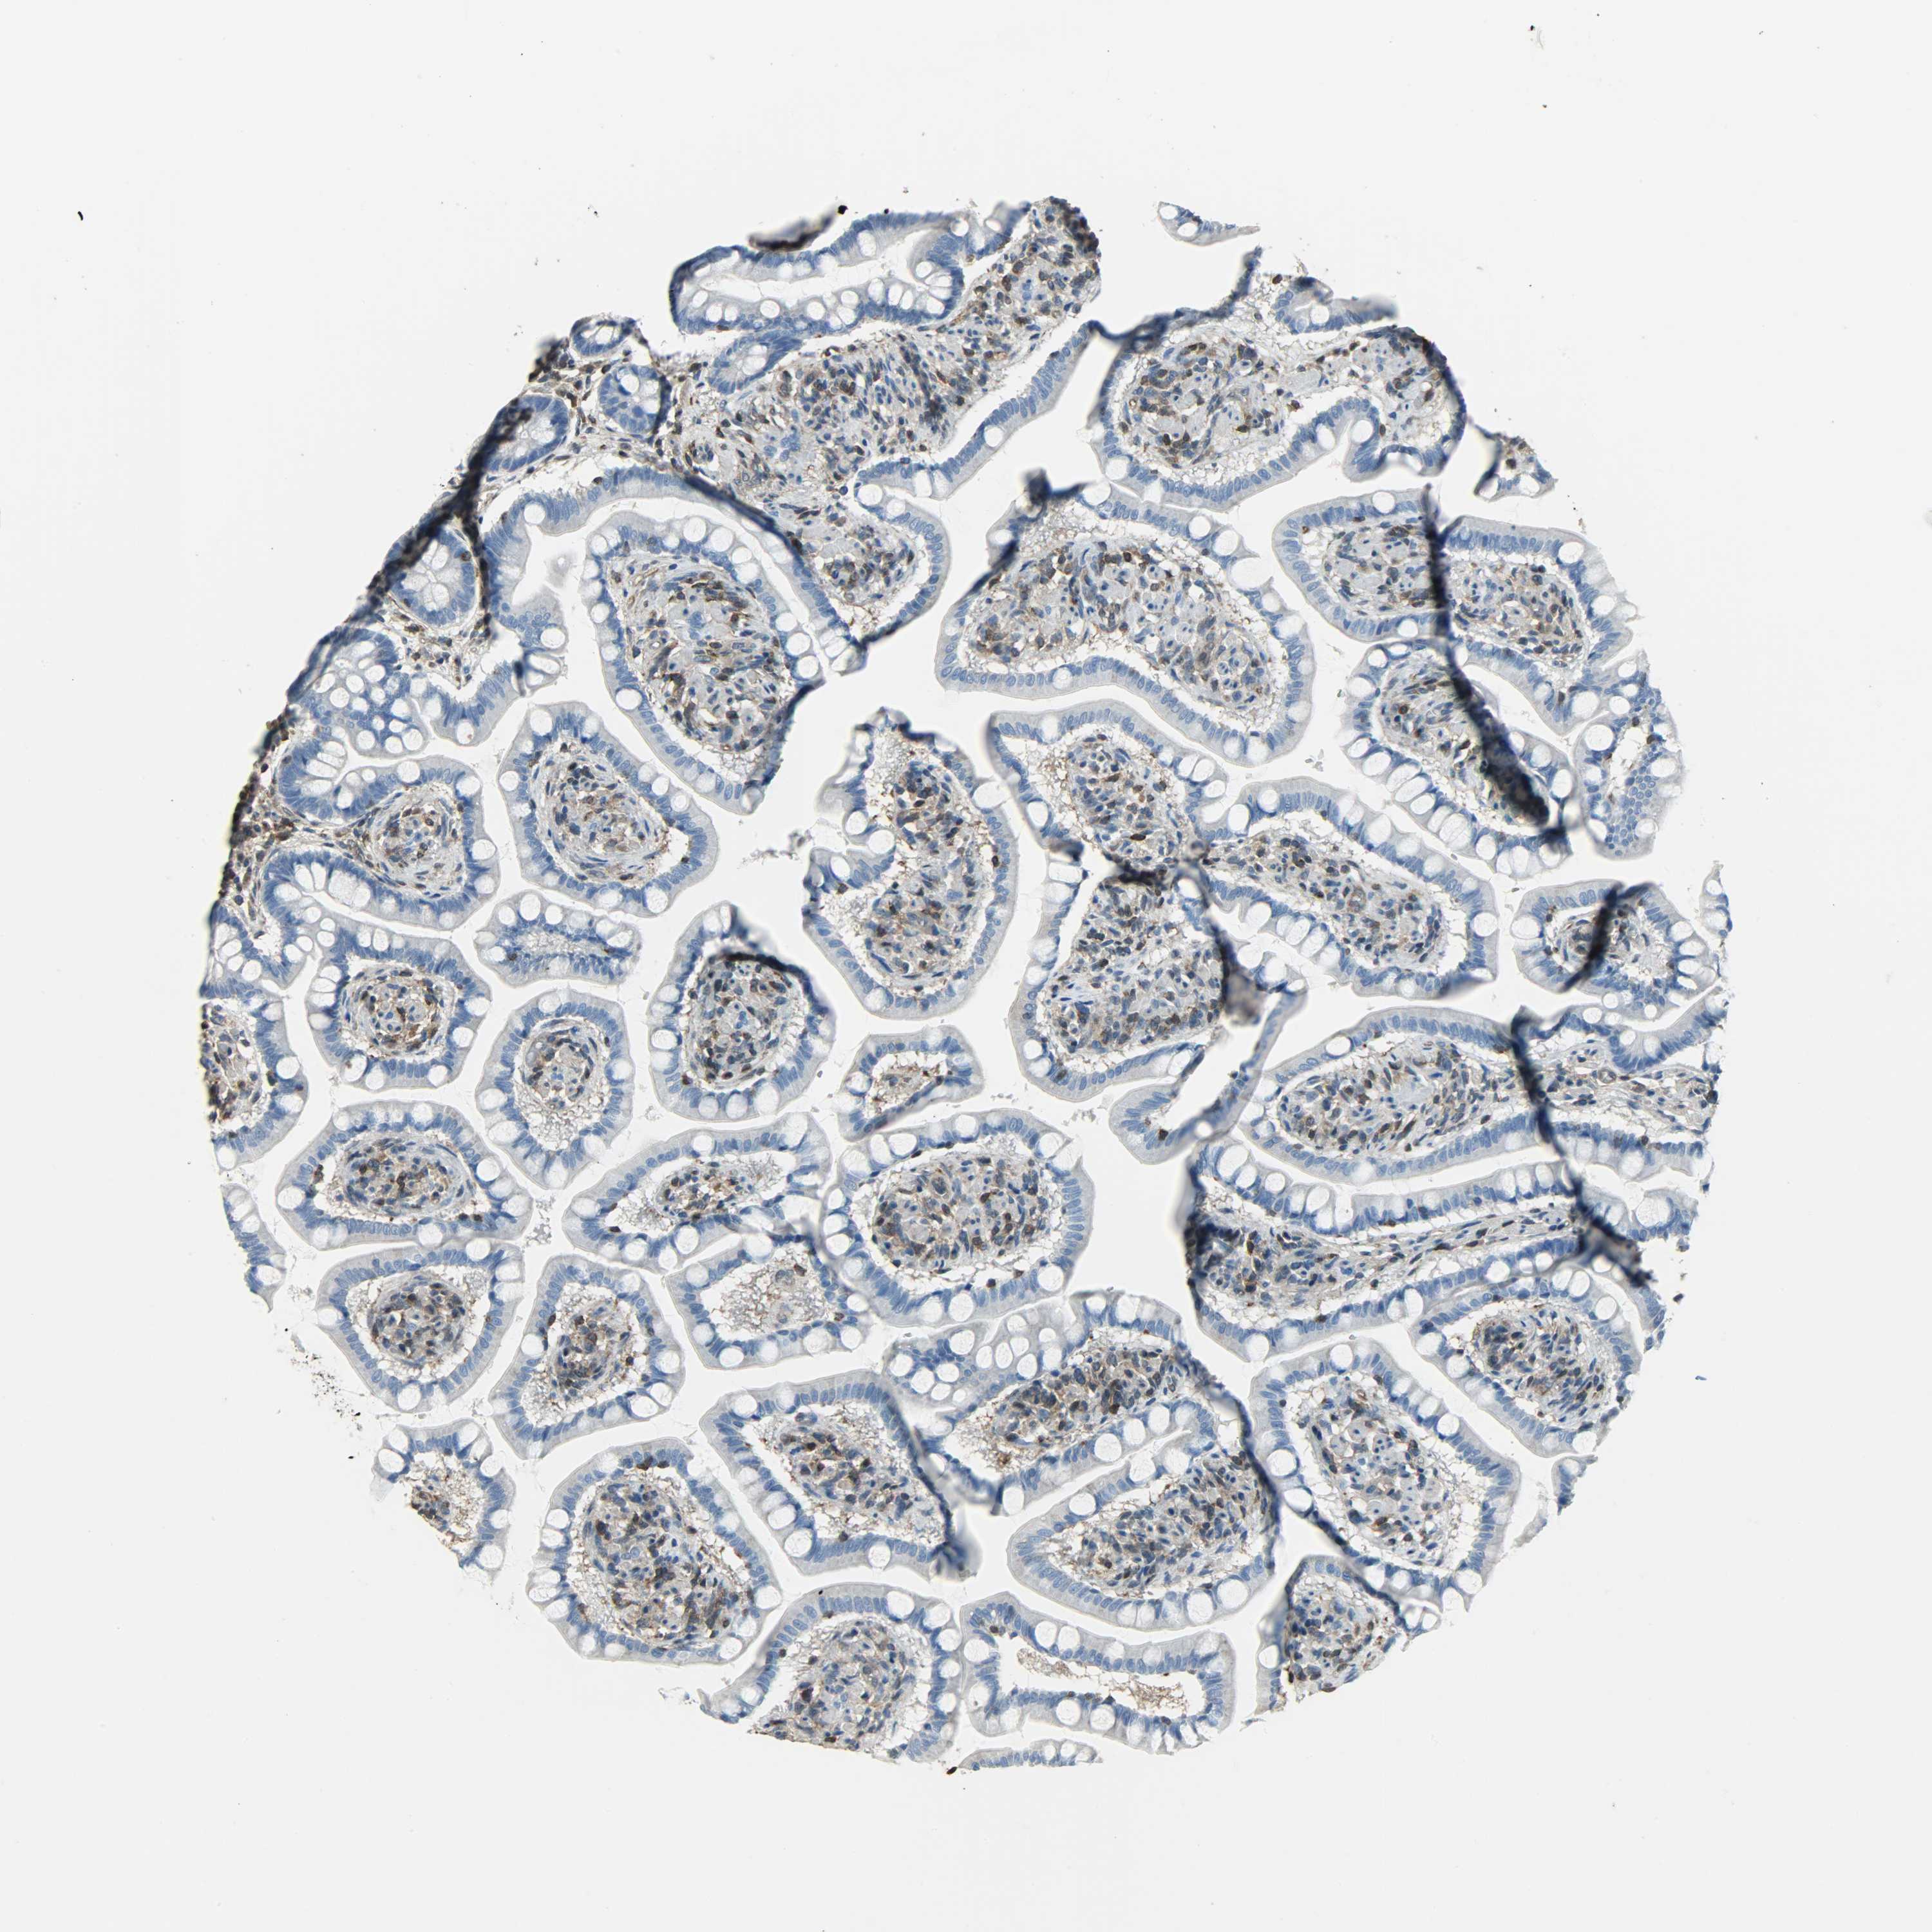
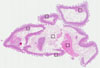
SMALL INTESTINE

ANTIBODIES
AND VALIDATION 
Dictionary
Small intestine
Tissue proteome
Intestine
|
|
||||||||||||||||||||||||||||||||||||||||||||||||||||||||||||||||||||||||||||||||||||||||||||||||||||||||||||||||||||||||||||||||||||||||||||||||||
 The Human Protein Atlas project is funded