Search result
SUMMARY

TISSUE
BRAIN
SINGLE CELL
SUBCELL
CANCER
BLOOD
CELL LINE
STRUCT & INT
|
TISSUE
PRIMARY DATA
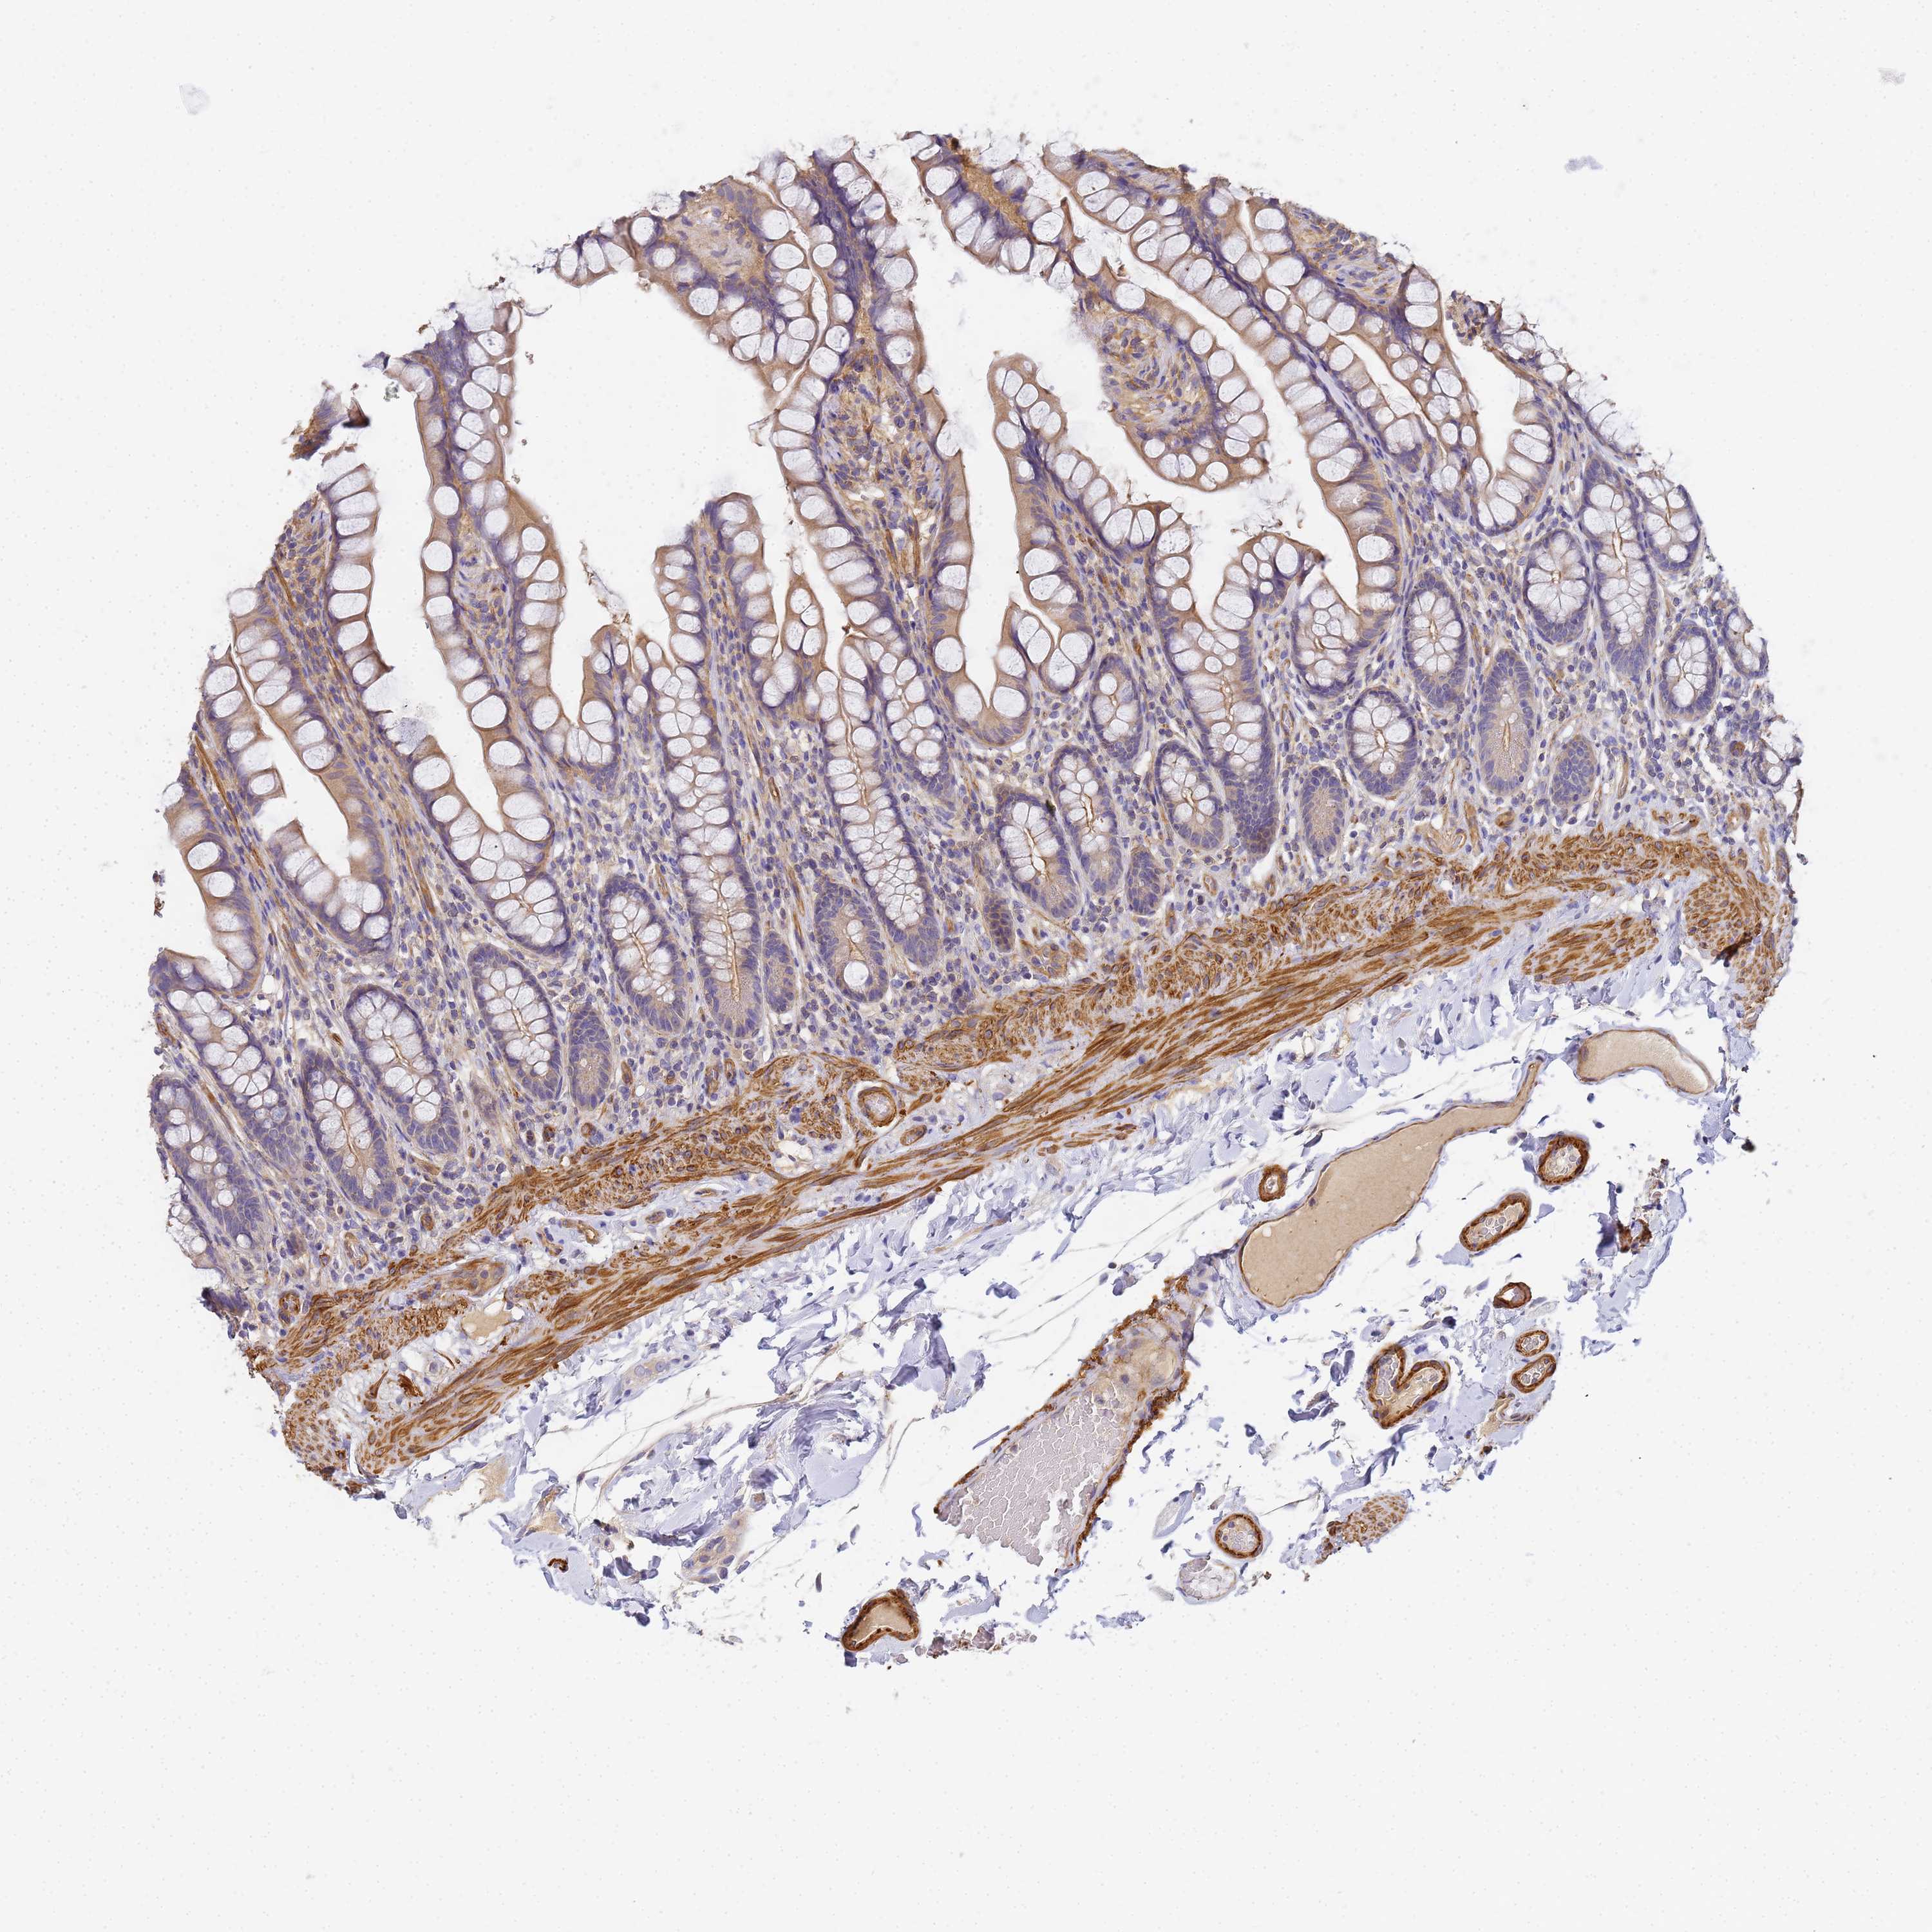
SMALL INTESTINE

ANTIBODIES
AND VALIDATION 
Dictionary
Small intestine
Tissue proteome
Intestine
|
|
|||||||||||||||||||||||||||||||||||||||||||||||||||||||||||||||||||||||||||||||||||||||||||||||||||||||||||||||||||||||||||||||||||||||||||||||||||||||||||||||||||||||||||||||||||||||
 The Human Protein Atlas project is funded