We use cookies to enhance the usability of our website. If you continue, we'll assume that you are happy to receive all cookies. More information. Don't show this again.
On the top, protein expression in current human tissue, based on all annotated cell types, is reported with the units not detected (n), low (l), medium (m) and high (h). Underneath, protein expression in each annotated cell type are reported using the same units.
Protein expression data is based on knowledge-based annotation. For genes where more than one antibody has been used, a collective score is set.
If knowledge-based annotation could not be performed for a gene, no data is displayed here. View antibody staining data further down this page.
h
m
l
n
Cells in glomeruli:
Medium
Cells in tubules:
Low
RNA expressioni
A summary of mRNA expression data available for current tissue based on several datasets. The mRNA expression levels in human tissues are based on RNA-seq data generated by the Human Protein Atlas (HPA), Genotype-Tissue Expression (GTEx) portal and CAGE data generated by the FANTOM5 consortium. Consensus normalized expression levels for human tissues was created by combining the data from HPA and GTEx datasets.
The mRNA expression levels in pig are based on RNA-seq data generated by the Human Protein Atlas (HPA), and for mouse, HPA data and in situ hybridization generated by the Allen brain atlas are reported.
Scroll down to view mRNA expression data in more detail.
Consensus:
4686.1
nTPM
HPA:
4283.0
nTPM
GTEx:
4686.1
nTPM
FANTOM5:
2564.4
Scaled Tags Per Million
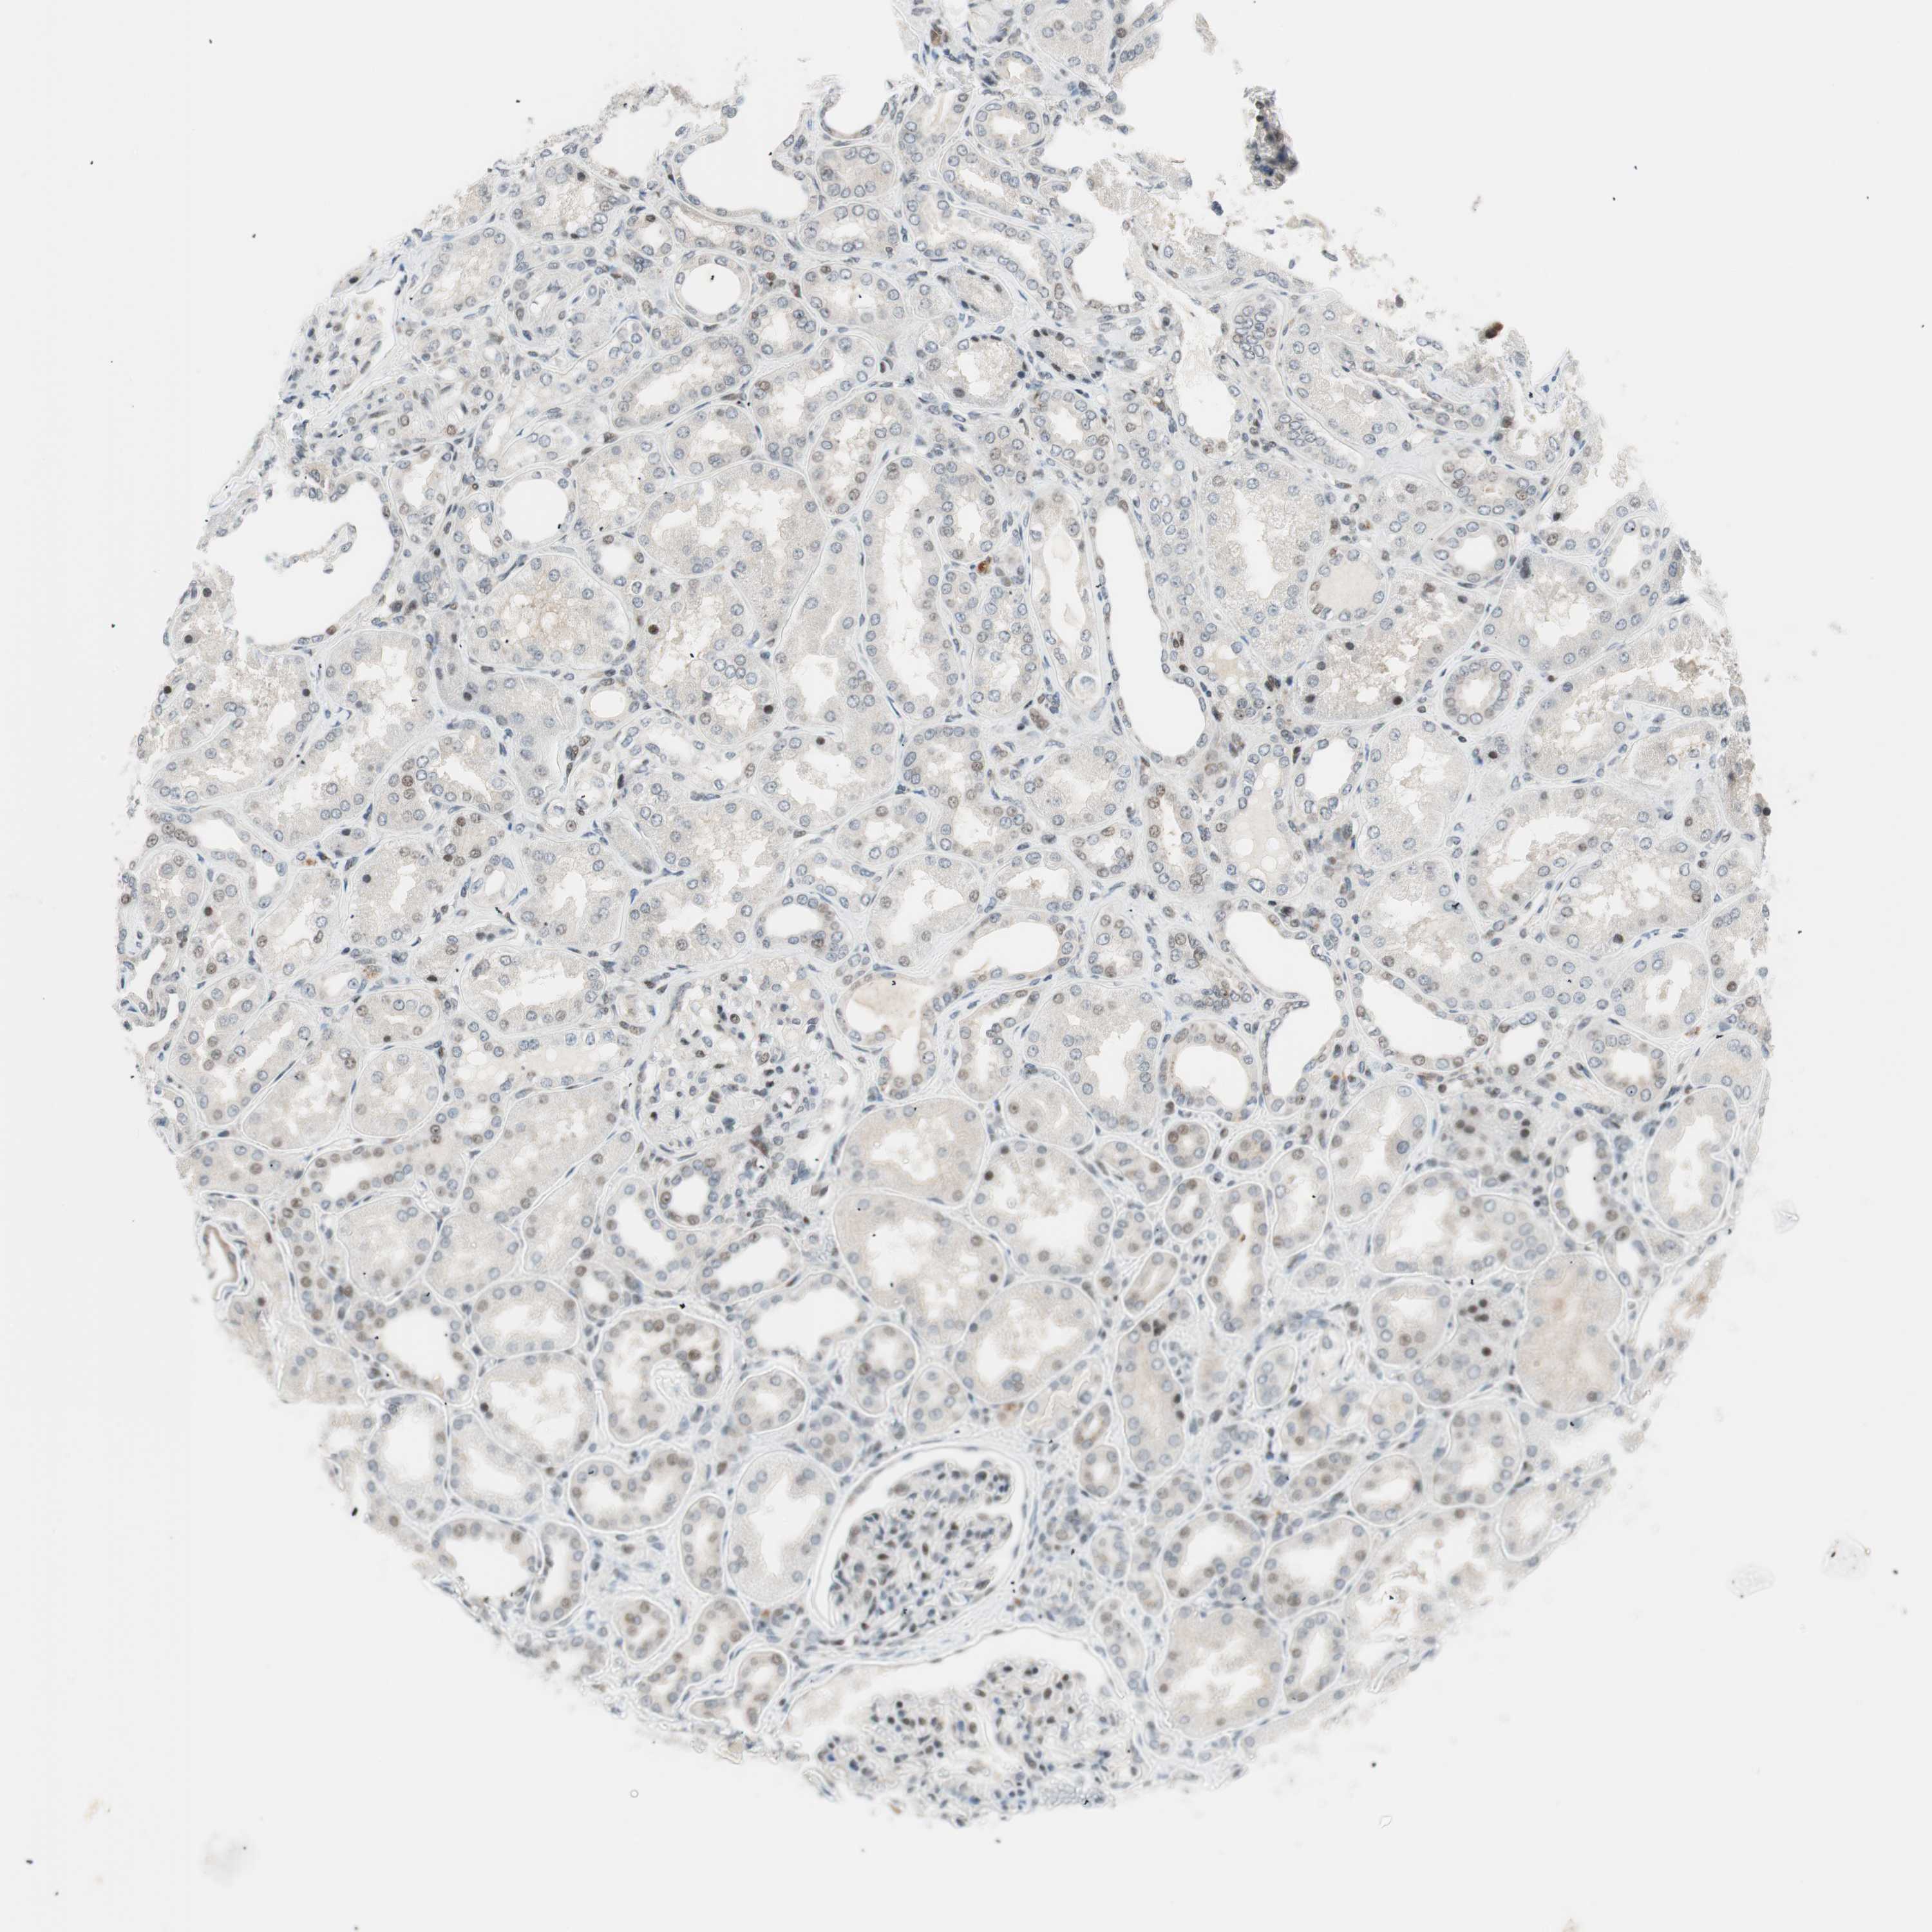
KIDNEY - Antibody stainingi
Antibody staining in the annotated cell types in the current human tissue is reported as not detected, low, medium, or high, based on conventional immunohistochemistry profiling in selected tissues. This score is based on the combination of the staining intensity and fraction of stained cells.
Each image is clickable and will lead to virtual microscopy that enables deeper exploration of all samples and also displays staining intensity scores, fraction scores and subcellular localization as well as patient and tissue information for each sample.
Antibody HPA039437
Antibody HPA073929
Antibody CAB008364
Cells in glomeruli
Medium
Not detected
Medium
Cells in tubules
Low
Low
Low
KIDNEY - HPA RNA-seqi
The RNA-seq details section shows detailed information about the individual samples used for the transcript profiling and results of the RNA-seq analysis.
Information about each individual sample is listed below, including gender, age, a tissue section image and estimated fractions of cell types. nTPM (normalized transcripts per million) values give a quantification of the gene abundance which is comparable between different genes and samples.
Average nTPMi
Max subtype nTPM is the value for the subtype with the largest average nTPM across the subtype samples.
4283.0
Female, age 58
Kidney sample 55 nTPM: 4194
Cell types%
Cells in tubules:
60
Cells in glomeruli:
20
Fibroblasts:
5
Other cell types:
15
Female, age 67
Kidney sample 56 nTPM: 4644.3
Cell types%
Cells in tubules:
70
Cells in glomeruli:
15
Fibroblasts:
10
Other cell types:
5
Female, age 55
Kidney sample 57 nTPM: 2106.7
Cell types%
Cells in tubules:
80
Cells in glomeruli:
10
Fibroblasts:
5
Other cell types:
5
Male, age 46
Kidney sample 58 nTPM: 4791.3
Cell types%
Cells in tubules:
60
Cells in glomeruli:
25
Fibroblasts:
5
Other cell types:
10
Female, age 57
Kidney sample 358 nTPM: 4451.6
Cell types%
Cells in tubules:
60
Cells in glomeruli:
10
Fibroblasts:
10
Other cell types:
20
Male, age 78
Kidney sample 377 nTPM: 3734.6
Cell types%
Cells in tubules:
65
Cells in glomeruli:
10
Fibroblasts:
5
Other cell types:
20
Male, age 73
Kidney sample 380 nTPM: 7632.7
Cell types%
Cells in tubules:
60
Cells in glomeruli:
10
Fibroblasts:
10
Other cell types:
20
Female, age 59
Kidney sample 394 nTPM: 2398.9
Cell types%
Cells in tubules:
65
Cells in glomeruli:
10
Fibroblasts:
10
Other cell types:
15
Female, age 48
Kidney sample 414 nTPM: 4592.9
Cell types%
Cells in tubules:
60
Cells in glomeruli:
5
Fibroblasts:
10
Other cell types:
25
KIDNEY - GTEx RNA-seqi
RNA-Seq data generated by the Genotype-Tissue Expression (GTEx) project from human tissues is reported as mean nTPM. More information can be found on the GTEx portal.
Distribution across the dataset is visualized with box plots, shown as median and 25th and 75th percentiles. Points are displayed as outliers if they are above or below 1.5 times the interquartile range. nTPM values of the individual samples are presented next to the box plot.
Max subtype nTPMi
Max subtype nTPM is the value for the subtype with the largest average nTPM across the subtype samples.
4686.1
GTEx sample id
Sample description
nTPM
Kidney - Cortex Average nTPM: 4686.1
Samples: 85
Max nTPM: 11208.6
Min nTPM: 1880.1
Std nTPM: 2133.1
Median nTPM: 4184.4
GTEX-1JMQJ-1726-SM-E9U4V
50-59 years, male
11208.6
GTEX-13NYB-1726-SM-5N9G2
40-49 years, male
10998.2
GTEX-11TTK-1926-SM-5PNW8
60-69 years, female
9927.9
GTEX-14E6D-2526-SM-5YYA9
50-59 years, male
9854.9
GTEX-T6MN-1826-SM-EXOHN
50-59 years, male
9763.7
GTEX-NPJ8-2226-SM-3TW8D
40-49 years, male
8929.4
GTEX-14C5O-2026-SM-5YYB1
60-69 years, male
8362.2
GTEX-1JMPZ-1226-SM-ARU8Y
30-39 years, male
7621.8
GTEX-1PWST-2226-SM-EVR3G
70-79 years, male
7598.8
GTEX-15CHQ-2126-SM-6871M
60-69 years, male
7147.9
GTEX-1KWVE-0826-SM-CXZKO
30-39 years, male
6953.4
GTEX-17HHY-2326-SM-7KFSR
50-59 years, male
6814.3
GTEX-T5JC-1526-SM-4DM68
20-29 years, male
6707.1
GTEX-1CB4J-1926-SM-7MGX8
60-69 years, male
6525.4
GTEX-1J1OQ-1426-SM-AHZ3P
40-49 years, female
6504.6
GTEX-1NV8Z-2226-SM-EXOJ2
60-69 years, male
6502.2
GTEX-1C6VQ-2326-SM-7IGN1
50-59 years, male
6416.2
GTEX-11OF3-1326-SM-5N9FJ
60-69 years, male
6414.8
GTEX-1HB9E-1826-SM-D4P33
50-59 years, male
6264.8
GTEX-O5YV-1226-SM-EV795
60-69 years, female
6178.3
GTEX-1GTWX-1826-SM-9QEHG
60-69 years, male
6071.9
GTEX-ZDXO-0226-SM-4WKH7
60-69 years, male
5851.1
GTEX-1R9PO-1626-SM-E6CPT
60-69 years, female
5553.8
GTEX-13RTJ-2226-SM-5S2Q1
60-69 years, male
5449.6
GTEX-QDT8-1726-SM-EYYV6
30-39 years, female
5341.5
GTEX-REY6-1826-SM-EAZAT
60-69 years, male
5300.9
GTEX-1JMQK-1926-SM-CJI3B
60-69 years, male
5216.8
GTEX-1GF9V-1926-SM-9JGHE
60-69 years, male
5113.4
GTEX-1QP6S-1526-SM-EXUSG
40-49 years, male
5093.7
GTEX-1H3NZ-2126-SM-9WPQ6
60-69 years, male
4998.5
GTEX-1GF9W-1326-SM-7P8PX
60-69 years, male
4961.1
GTEX-1BAJH-1826-SM-731DA
70-79 years, male
4889.5
GTEX-1IKK5-0926-SM-A9G2U
60-69 years, male
4722.2
GTEX-15DYW-2026-SM-6AJBD
60-69 years, female
4693.3
GTEX-1N2DW-1826-SM-EAZ54
50-59 years, male
4603.1
GTEX-1HCU7-1826-SM-A9G2A
50-59 years, male
4513.3
GTEX-1F48J-2226-SM-7MXTN
50-59 years, female
4450.8
GTEX-1K9T9-1826-SM-CXZK2
50-59 years, female
4384.7
GTEX-13OW6-1826-SM-5N9F9
50-59 years, male
4346.8
GTEX-14C39-2126-SM-664OH
40-49 years, male
4321.8
GTEX-1A3MW-2226-SM-73KUX
60-69 years, female
4287.3
GTEX-16MT8-1926-SM-7EPGL
60-69 years, female
4284.0
GTEX-S33H-1426-SM-EZ6L7
30-39 years, male
4184.4
GTEX-17F96-1926-SM-7MGWY
70-79 years, male
4156.1
GTEX-13O1R-2526-SM-5N9FW
60-69 years, male
4125.9
GTEX-1HBPI-2026-SM-CE6RZ
50-59 years, male
4097.8
GTEX-1E2YA-1626-SM-7MGXS
50-59 years, male
3958.5
GTEX-1I1GP-1926-SM-CNNQU
50-59 years, male
3891.4
GTEX-ZC5H-1726-SM-5HL7X
40-49 years, female
3840.8
GTEX-1IL2V-1826-SM-ARU7R
70-79 years, male
3829.4
GTEX-17F97-1926-SM-7IGM4
50-59 years, male
3763.5
GTEX-1LG7Y-2726-SM-D5OVW
50-59 years, male
3725.8
GTEX-1JJ6O-2526-SM-AHZ3J
60-69 years, male
3702.9
GTEX-1A8FM-2026-SM-7P8RN
50-59 years, female
3689.7
GTEX-1N2EF-1426-SM-EXUSH
60-69 years, male
3641.4
GTEX-1GMR3-2426-SM-7MXV2
40-49 years, male
3543.0
GTEX-1GN1U-2126-SM-AHZ4J
50-59 years, female
3535.4
GTEX-147F4-2626-SM-5Q5CS
50-59 years, male
3445.6
GTEX-1EKGG-2226-SM-7IGOA
60-69 years, male
3418.4
GTEX-13OVL-1826-SM-5KLZR
50-59 years, male
3403.0
GTEX-12WSG-0826-SM-5EQ5A
50-59 years, female
3288.8
GTEX-13OVI-1126-SM-5KLZF
60-69 years, female
3237.6
GTEX-ZE9C-1426-SM-4WKGM
60-69 years, male
3224.9
GTEX-ZYT6-2226-SM-5GIC9
30-39 years, male
3134.5
GTEX-13112-2126-SM-5GCO4
50-59 years, male
3129.4
GTEX-P4QS-1126-SM-3NMD5
60-69 years, male
3050.9
GTEX-11GS4-2326-SM-5A5KS
60-69 years, male
2932.2
GTEX-1MUQO-2526-SM-E9TJN
60-69 years, male
2908.8
GTEX-1JMLX-1526-SM-AHZ3N
50-59 years, male
2890.5
GTEX-1399S-0526-SM-5IJG8
30-39 years, female
2777.5
GTEX-ZLFU-0926-SM-5P9F8
40-49 years, male
2656.5
GTEX-1AX8Z-2326-SM-731CR
60-69 years, male
2601.5
GTEX-QDVN-1626-SM-48TZC
50-59 years, male
2567.2
GTEX-145MN-0326-SM-5QGQI
30-39 years, male
2537.0
GTEX-1497J-0826-SM-5NQAJ
60-69 years, male
2418.3
GTEX-1H3VY-1926-SM-9JGHJ
50-59 years, male
2414.0
GTEX-1OJC4-2326-SM-DTXA5
50-59 years, female
2359.1
GTEX-Y5V6-2026-SM-5IFHO
60-69 years, male
2342.5
GTEX-Y5V5-1226-SM-EYYVP
60-69 years, female
2232.1
GTEX-RN64-1626-SM-48FD7
50-59 years, male
2217.7
GTEX-12696-0926-SM-5FQTV
60-69 years, male
2200.8
GTEX-XPVG-0526-SM-4B65N
50-59 years, male
2197.7
GTEX-ZYFG-1626-SM-5GZYY
60-69 years, female
2060.3
GTEX-ZVZP-0926-SM-5GIDB
50-59 years, male
1965.3
GTEX-QLQW-1626-SM-CMKFE
30-39 years, male
1880.1
Show allShow less
Kidney - Medulla Average nTPM: 3310.0
Samples: 4
Max nTPM: 5801.6
Min nTPM: 1786.7
Std nTPM: 1666.5
Median nTPM: 2825.8
GTEX-RU72-1926-SM-EAZ3F
50-59 years, female
5801.6
GTEX-T5JC-1626-SM-EZ6KW
20-29 years, male
3853.3
GTEX-R55E-2026-SM-EZ6L1
20-29 years, male
1798.3
GTEX-TKQ2-0626-SM-EZ6LB
50-59 years, male
1786.7
KIDNEY - FANTOM5 CAGEi
RNA expression in human tissues obtained through Cap Analysis of Gene Expression (CAGE) generated by the FANTOM5 project are reported as Scaled Tags Per Million.
Max subtype Scaled Tags Per Millioni
Max subtype Scaled Tags Per Million is the value for the subtype with the largest average Scaled Tags Per Million across the subtype samples.
 The Human Protein Atlas project is funded