We use cookies to enhance the usability of our website. If you continue, we'll assume that you are happy to receive all cookies. More information. Don't show this again.
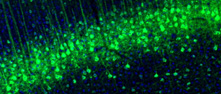
On the top, protein expression in current human tissue, based on all annotated cell types, is reported with the units not detected (n), low (l), medium (m) and high (h). Underneath, protein expression in each annotated cell type are reported using the same units.
Protein expression data is based on knowledge-based annotation. For genes where more than one antibody has been used, a collective score is set.
If knowledge-based annotation could not be performed for a gene, no data is displayed here. View antibody staining data further down this page.
No data
RNA expressioni
A summary of mRNA expression data available for current tissue based on several datasets. The mRNA expression levels in human tissues are based on RNA-seq data generated by the Human Protein Atlas (HPA), Genotype-Tissue Expression (GTEx) portal and CAGE data generated by the FANTOM5 consortium. Consensus normalized expression levels for human tissues was created by combining the data from HPA and GTEx datasets.
The mRNA expression levels in pig are based on RNA-seq data generated by the Human Protein Atlas (HPA), and for mouse, HPA data and in situ hybridization generated by the Allen brain atlas are reported.
Scroll down to view mRNA expression data in more detail.
Consensus:
319.3
nTPM
HPA Brain:
124.3
nTPM
GTEx:
319.3
nTPM
FANTOM5:
62.9
Scaled Tags Per Million
Pig:
30.5
nTPM
SPINAL CORD - HPA Brain RNA-seq
Max subtype nTPMi
Max subtype nTPM is the value for the subtype with the largest average nTPM across the subtype samples.
124.3
Sample id
Sample description
nTPM
Cervical spinal cord, central gray nTPM: 107.3
2048
Male, age 55, midline
142.4
1981
Female, age 72, midline
131.8
2816
Male, age 47, midline
94.1
2565
Male, age 75, midline
85.4
2194
Female, age 79, both hemispheres
82.7
Cervical spinal cord, dorsal horn nTPM: 104.2
2173
Female, age 72, unknown
160.3
2296
Male, age 66, both hemispheres
142.0
1877
Male, age 55, unknown
109.6
2069
Male, age 47, both hemispheres
98.8
2297
Male, age 75, both hemispheres
59.0
2721
Male, age 90, both hemispheres
55.6
Cervical spinal cord, ventral horn nTPM: 124.3
2098
Female, age 72, unknown
169.6
2809
Male, age 90, both hemispheres
148.0
2480
Male, age 75, both hemispheres
122.4
2295
Male, age 66, both hemispheres
117.2
2068
Male, age 55, unknown
112.8
2820
Female, age 79, both hemispheres
75.5
SPINAL CORD - GTEx RNA-seqi
RNA-Seq data generated by the Genotype-Tissue Expression (GTEx) project from human tissues is reported as mean nTPM. More information can be found on the GTEx portal.
Distribution across the dataset is visualized with box plots, shown as median and 25th and 75th percentiles. Points are displayed as outliers if they are above or below 1.5 times the interquartile range. nTPM values of the individual samples are presented next to the box plot.
Max subtype nTPMi
Max subtype nTPM is the value for the subtype with the largest average nTPM across the subtype samples.
319.3
GTEx sample id
Sample description
nTPM
Brain - Spinal cord (cervical c-1) Average nTPM: 319.3
Samples: 159
Max nTPM: 618.4
Min nTPM: 86.3
Std nTPM: 109.2
Median nTPM: 310.8
GTEX-1EKGG-0011-R9a-SM-CMKFV
60-69 years, male
618.4
GTEX-1KANB-0011-R9b-SM-EZ6MO
50-59 years, male
611.5
GTEX-1IGQW-0011-R9b-SM-D4P25
60-69 years, male
581.5
GTEX-1GN2E-0011-R9b-SM-9WG7F
60-69 years, male
574.5
GTEX-11WQK-0011-R9b-SM-5BC6N
50-59 years, male
572.6
GTEX-13FTY-0011-R9b-SM-5KM2U
40-49 years, female
553.2
GTEX-14E7W-0011-R9a-SM-62LE6
70-79 years, male
539.3
GTEX-1HGF4-0011-R9a-SM-ADEH9
60-69 years, male
528.9
GTEX-1LB8K-0011-R9a-SM-EZ6MP
50-59 years, male
528.4
GTEX-1IY9M-0011-R9b-SM-D3L8J
60-69 years, male
524.5
GTEX-1H1DF-0011-R9b-SM-CM2RN
40-49 years, female
509.6
GTEX-1H3O1-0011-R9b-SM-CM2SQ
60-69 years, male
504.7
GTEX-1CB4H-0011-R9a-SM-CKZNL
60-69 years, female
493.2
GTEX-1CAV2-0011-R9b-SM-9WG5M
40-49 years, female
487.3
GTEX-1I1GS-0011-R9b-SM-CMKHF
60-69 years, male
474.2
GTEX-148VJ-0011-R9b-SM-5SI77
70-79 years, male
467.1
GTEX-11UD2-0011-R9b-SM-DO926
50-59 years, male
458.8
GTEX-1J8JJ-0011-R9a-SM-ACKVF
60-69 years, female
455.6
GTEX-1HBPH-0011-R9a-SM-CMKH3
40-49 years, female
451.8
GTEX-139UW-0011-R9b-SM-5LZYT
60-69 years, male
451.4
GTEX-1J8EW-0011-R9b-SM-D4P2F
60-69 years, female
450.2
GTEX-1HSMO-0011-R9b-SM-CM2T2
60-69 years, male
439.9
GTEX-1C6VQ-0011-R9a-SM-7SB85
50-59 years, male
438.8
GTEX-1EU9M-0011-R9a-SM-9WG61
60-69 years, male
438.2
GTEX-1OJC4-0011-R9a-SM-EZ6N1
50-59 years, female
434.2
GTEX-T6MN-0011-R9A-SM-32QOZ
50-59 years, male
428.7
GTEX-145LU-0011-R9b-SM-5SI66
50-59 years, male
426.3
GTEX-1JN1M-0011-R9a-SM-EZ6MR
60-69 years, female
419.7
GTEX-1EH9U-0011-R9b-SM-9WG5T
60-69 years, male
413.4
GTEX-1I19N-0011-R9a-SM-CMKHN
70-79 years, male
407.2
GTEX-13N1W-0011-R9b-SM-5MR4R
70-79 years, male
406.5
GTEX-11EMC-0011-R9b-SM-DO921
60-69 years, female
406.3
GTEX-11GSP-0011-R9b-SM-5NQ77
60-69 years, female
400.2
GTEX-131XW-0011-R9a-SM-5N9EO
50-59 years, female
398.7
GTEX-QVUS-0011-R9A-SM-3GIJA
60-69 years, female
398.6
GTEX-1A8G7-0011-R9b-SM-7IGQH
60-69 years, male
396.8
GTEX-13PVQ-0011-R9b-SM-5LU3B
50-59 years, male
389.3
GTEX-13O1R-0011-R9b-SM-5KM33
60-69 years, male
385.8
GTEX-1EWIQ-0011-R9a-SM-ARL8L
70-79 years, female
383.3
GTEX-13PL6-0011-R9b-SM-5O9CH
40-49 years, female
382.6
GTEX-1GF9V-0011-R9a-SM-CL53K
60-69 years, male
380.9
GTEX-13NYB-0011-R9b-SM-5MR5P
40-49 years, male
380.4
GTEX-ZE9C-0011-R9a-SM-4WWCY
60-69 years, male
377.1
GTEX-1MJK2-0011-R9b-SM-EZ6MZ
50-59 years, male
368.8
GTEX-131YS-0011-R9b-SM-5EQLY
60-69 years, female
368.6
GTEX-12WSH-0011-R9b-SM-5LZUG
50-59 years, male
367.0
GTEX-139T4-0011-R9b-SM-5HL6S
50-59 years, female
366.6
GTEX-13CZV-0011-R9a-SM-5LZXT
60-69 years, male
365.3
GTEX-16Z82-0011-R9a-SM-7DUFA
60-69 years, male
363.6
GTEX-1B8L1-0011-R9b-SM-9WG5U
60-69 years, male
363.1
GTEX-1HBPI-0011-R9b-SM-ARL76
50-59 years, male
362.4
GTEX-13PLJ-0011-R9b-SM-5O9DV
60-69 years, female
361.6
GTEX-1LVA9-0011-R9a-SM-EYYWF
50-59 years, male
360.0
GTEX-11ZVC-0011-R9a-SM-57WC5
50-59 years, female
359.6
GTEX-1JJ6O-0011-R9a-SM-EYYXP
60-69 years, male
351.0
GTEX-1LSNL-0011-R9b-SM-EYYWK
50-59 years, male
347.3
GTEX-1IDJH-0011-R9a-SM-ADEIN
70-79 years, male
346.8
GTEX-1CAMQ-0011-R9a-SM-9WG5Z
40-49 years, male
344.4
GTEX-14E6C-0011-R9a-SM-6EU33
40-49 years, male
340.9
GTEX-1H1DG-0011-R9b-SM-ACKVB
70-79 years, male
339.4
GTEX-1GN1U-0011-R9b-SM-CMKFW
50-59 years, female
338.9
GTEX-1I1CD-0011-R9a-SM-CMKHB
60-69 years, female
337.7
GTEX-1HBPM-0011-R9b-SM-ARL7C
60-69 years, female
335.5
GTEX-TSE9-0011-R9A-SM-3DB7Q
60-69 years, female
334.1
GTEX-1H3NZ-0011-R9a-SM-ADEH7
60-69 years, male
329.6
GTEX-ZVZQ-0011-R9a-SM-51MRH
60-69 years, female
328.9
GTEX-1F6I4-0011-R9a-SM-CMKFU
60-69 years, male
328.8
GTEX-16NPV-0011-R9b-SM-79ONF
50-59 years, female
328.4
GTEX-1GTWX-0011-R9a-SM-ADEH4
60-69 years, male
326.2
GTEX-1C6VS-0011-R9b-SM-9WG5W
60-69 years, male
326.0
GTEX-1192X-0011-R9b-SM-DO934
50-59 years, male
321.0
GTEX-XLM4-0011-R9A-SM-4AT45
60-69 years, male
319.1
GTEX-QDT8-0011-R9A-SM-CYPRD
30-39 years, female
318.7
GTEX-11ZUS-0011-R9b-SM-5BC76
30-39 years, male
317.8
GTEX-RU72-0011-R9A-SM-2TF67
50-59 years, female
317.2
GTEX-14BIN-0011-R9a-SM-5SI76
50-59 years, female
316.8
GTEX-1A32A-0011-R9b-SM-7MGXD
50-59 years, female
314.5
GTEX-13CIG-0011-R9a-SM-5K7VU
50-59 years, male
312.4
GTEX-11ZTS-0011-R9b-SM-DO93Q
60-69 years, female
311.3
GTEX-1F52S-0011-R9a-SM-9WG62
60-69 years, female
310.8
GTEX-Q2AG-0011-R9A-SM-2HMJ6
40-49 years, female
310.7
GTEX-14ABY-0011-R9a-SM-5PNZK
50-59 years, male
309.9
GTEX-1F88F-0011-R9b-SM-9WG7L
60-69 years, female
309.1
GTEX-1I1GV-0011-R9b-SM-ARZLE
60-69 years, male
307.8
GTEX-T5JC-0011-R9A-SM-32PLV
20-29 years, male
305.7
GTEX-15ER7-0011-R9b-SM-6PALF
20-29 years, female
305.1
GTEX-PWO3-0011-R9A-SM-EVR2V
60-69 years, female
305.1
GTEX-ZF28-0011-R9a-SM-4WWDY
60-69 years, male
304.7
GTEX-1GZ2Q-0011-R9a-SM-9WG7A
40-49 years, male
303.8
GTEX-OXRO-0011-R9A-SM-3NB1X
60-69 years, female
302.3
GTEX-YJ89-0011-R9a-SM-4SOK7
60-69 years, male
299.8
GTEX-12126-0011-R9b-SM-5BC6P
20-29 years, male
299.5
GTEX-1BAJH-0011-R9b-SM-7EPIQ
70-79 years, male
295.3
GTEX-NL4W-0011-R9a-SM-2I3G1
50-59 years, male
294.9
GTEX-1RQEC-0011-R9a-SM-EZ6N3
60-69 years, male
290.7
GTEX-1H1ZS-0011-R9a-SM-CM2SO
70-79 years, male
289.8
GTEX-13OVL-0011-R9a-SM-5P9GX
50-59 years, male
288.8
GTEX-14BIM-0011-R9a-SM-6LLJL
60-69 years, female
286.2
GTEX-13QJC-0011-R9b-SM-5PNX3
60-69 years, female
284.8
GTEX-14BMV-0011-R9b-SM-5ZZUA
50-59 years, male
278.4
GTEX-11ONC-0011-R9b-SM-5NQ8J
60-69 years, male
277.8
GTEX-1R46S-0011-R9a-SM-EZ6N7
60-69 years, female
274.0
GTEX-13FLV-0011-R9b-SM-5L3DA
50-59 years, male
272.3
GTEX-14PJO-0011-R9b-SM-62LE9
60-69 years, male
271.8
GTEX-14PJM-0011-R9b-SM-6EU35
50-59 years, female
263.6
GTEX-1HR98-0011-R9b-SM-ARL79
60-69 years, male
263.4
GTEX-1JMLX-0011-R9a-SM-EYYXM
50-59 years, male
262.8
GTEX-17EVQ-0011-R9b-SM-79OJY
70-79 years, male
259.3
GTEX-12WSC-0011-R9a-SM-5GU4U
50-59 years, male
252.6
GTEX-XMD1-0011-R9A-SM-4AT49
60-69 years, male
252.6
GTEX-13X6I-0011-R9b-SM-5PNZJ
60-69 years, male
251.7
GTEX-13N2G-0011-R9b-SM-5MR4E
60-69 years, male
251.1
GTEX-147GR-0011-R9a-SM-5S2UY
60-69 years, male
250.6
GTEX-OHPN-0011-R9A-SM-5TDEJ
60-69 years, female
250.4
GTEX-13RTJ-0011-R9a-SM-5Q5AY
60-69 years, male
248.7
GTEX-13NZA-0011-R9b-SM-5MR5I
60-69 years, male
247.5
GTEX-13VXU-0011-R9b-SM-5SI73
50-59 years, male
242.2
GTEX-1H23P-0011-R9a-SM-CM2T1
60-69 years, male
241.9
GTEX-1GZ4I-0011-R9b-SM-B2LY8
50-59 years, male
239.2
GTEX-14BIL-0011-R9a-SM-5SI7A
50-59 years, male
238.5
GTEX-1GZHY-0011-R9a-SM-9WG5R
50-59 years, female
238.0
GTEX-1LVAO-0011-R9a-SM-EZ6MY
60-69 years, male
236.1
GTEX-13FXS-0011-R9a-SM-5K7UI
50-59 years, male
235.9
GTEX-15G19-0011-R9b-SM-7KUEE
60-69 years, male
235.9
GTEX-1I1HK-0011-R9a-SM-CMKHK
60-69 years, male
235.4
GTEX-1J1OQ-0011-R9b-SM-ARZMK
40-49 years, female
232.7
GTEX-13NYS-0011-R9b-SM-5MR44
60-69 years, male
232.4
GTEX-ZAB4-0011-R9a-SM-4SOKG
40-49 years, male
225.7
GTEX-1ICLZ-0011-R9a-SM-ARL7E
60-69 years, male
225.7
GTEX-1H2FU-0011-R9b-SM-CE6S4
60-69 years, female
225.6
GTEX-15DCD-0011-R9b-SM-7KUED
70-79 years, female
223.2
GTEX-1B933-0011-R9a-SM-79OOR
50-59 years, female
222.4
GTEX-13S7M-0011-R9a-SM-5O9DW
60-69 years, female
222.0
GTEX-1GF9W-0011-R9b-SM-9WG7J
60-69 years, male
218.5
GTEX-13SLX-0011-R9b-SM-5SI6X
50-59 years, female
215.9
GTEX-13JUV-0011-R9a-SM-5LZX3
40-49 years, female
206.8
GTEX-NPJ8-0011-R9a-SM-2YUN5
40-49 years, male
205.4
GTEX-1HFI6-0011-R9b-SM-CMKH4
40-49 years, male
205.3
GTEX-15EO6-0011-R9a-SM-6PALG
50-59 years, male
202.2
GTEX-WL46-0011-R9A-SM-3MJFP
50-59 years, male
201.7
GTEX-13SLW-0011-R9a-SM-5O9BT
70-79 years, male
200.4
GTEX-13OVJ-0011-R9b-SM-5L3GD
50-59 years, female
191.3
GTEX-12WSD-0011-R9a-SM-5GU6W
60-69 years, female
188.1
GTEX-15DYW-0011-R9b-SM-6PALB
60-69 years, female
181.3
GTEX-16XZZ-0011-R9b-SM-7DHKX
60-69 years, male
174.4
GTEX-11DZ1-0011-R9a-SM-DO933
50-59 years, male
171.4
GTEX-1IKJJ-0011-R9a-SM-ARZLI
60-69 years, male
163.1
GTEX-QVJO-0011-R9A-SM-2S1QH
60-69 years, female
160.9
GTEX-18464-0011-R9a-SM-731BK
50-59 years, male
156.8
GTEX-15CHQ-0011-R9a-SM-6LLHX
60-69 years, male
155.8
GTEX-14PN4-0011-R9a-SM-6LLH9
50-59 years, male
151.8
GTEX-13OW5-0011-R9b-SM-5O9CL
60-69 years, male
149.6
GTEX-14JIY-0011-R9a-SM-6EU34
60-69 years, male
149.2
GTEX-NPJ7-0011-R9a-SM-2TC5R
60-69 years, female
145.0
GTEX-RNOR-0011-R9A-SM-2TF52
50-59 years, female
136.5
GTEX-R55E-0011-R9A-SM-2TC6C
20-29 years, male
128.0
GTEX-15DDE-0011-R9b-SM-6M46U
50-59 years, female
113.8
GTEX-YFC4-0011-R9a-SM-4SOK4
40-49 years, female
109.5
GTEX-1GN73-0011-R9a-SM-CKZO5
60-69 years, male
86.3
Show allShow less
SPINAL CORD - FANTOM5 CAGEi
RNA expression in human tissues obtained through Cap Analysis of Gene Expression (CAGE) generated by the FANTOM5 project are reported as Scaled Tags Per Million.
Max subtype Scaled Tags Per Millioni
Max subtype Scaled Tags Per Million is the value for the subtype with the largest average Scaled Tags Per Million across the subtype samples.
Normal distribution across the dataset is visualized with box plots, shown as median and 25th and 75th percentiles. Points are displayed as outliers if they are above or below 1.5 times the interquartile range. nTPM values of the individual samples are presented next to the box plot.
Max subtype nTPMi
Max subtype nTPM is the value for the subtype with the largest average nTPM across the subtype samples.
 The Human Protein Atlas project is funded